Panel
Panel is a framework for building interactive tools for notebooks, dashboards, and web applications that can run on a server—all using Python.
Prerequisites
To run the code below, you need to install the following packages:
pip install panel colorcet ipywidgets_bokeh geopandas palettable lonboard pyogrio watchfiles matplotlib pyarrow
Tutorial
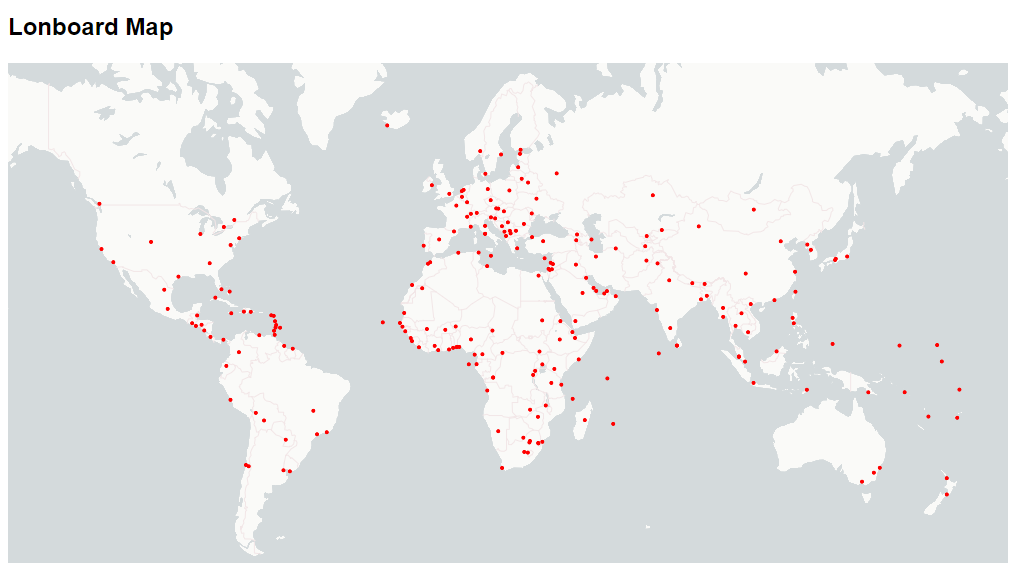
In this tutorial, you will learn how to display a lonboard Map via the IPyWidget pane.
Create a file named app.py with the following content:
import geopandas as gpd
from lonboard import Map, ScatterplotLayer
import panel as pn

pn.extension("ipywidgets")

@pn.cache
def get_data():
    return gpd.read_file(r"https://naciscdn.org/naturalearth/110m/cultural/ne_110m_populated_places_simple.zip")

gdf = get_data()
layer = ScatterplotLayer.from_geopandas(gdf, radius_min_pixels=2, get_fill_color="red")
cities_map = Map(layer)

# Fit to the available space
cities_map.layout.height = cities_map.layout.width = "100%"

pn.Column(
    "# Lonboard Map",
    pn.pane.IPyWidget(cities_map, height=500, width=1000),
).servable()
Now run:
panel serve app.py --autoreload
Finally, open http://localhost:5006 and you should see the lonboard map.
How to
Update the Map In Place
Panel supports in-place updates of lonboard Maps, allowing you to update details of a map efficiently without redrawing the entire map. This is useful for updating the map based on user interactions or on a schedule.
import geopandas as gpd
from lonboard import Map, ScatterplotLayer
import panel as pn

pn.extension("ipywidgets")

colors = {
    "Red": [200, 0, 0],
    "Green": [0, 200, 0],
    "Blue": [0, 0, 200],
}

@pn.cache
def get_data():
    return gpd.read_file(r"https://naciscdn.org/naturalearth/110m/cultural/ne_110m_populated_places_simple.zip")

gdf = get_data()
layer = ScatterplotLayer.from_geopandas(gdf, radius_min_pixels=2, get_fill_color="red")
cities_map = Map(layer)

# Fit to the available space
cities_map.layout.height = cities_map.layout.width = "100%"

color_input = pn.widgets.Select(
    name="Color", options=list(colors.keys()), description="The color of the points"
)

@pn.depends(value=color_input, watch=True)
def set_fill_color(value):
    cities_map.layers[0].get_fill_color = colors[value]

pn.Column(
    color_input,
    pn.pane.IPyWidget(cities_map, height=500, width=1000),
).servable()
Build an Application
With Panel, you can build reusable components and styled web applications in just a few lines of code.
The example below is based on the North America Roads example.
import colorcet as cc
import geopandas as gpd
import param

from lonboard import Map, PathLayer
from lonboard.colormap import apply_continuous_cmap
from lonboard._viewport import compute_view
from palettable.palette import Palette

import panel as pn

pn.extension("ipywidgets")

url = "https://naciscdn.org/naturalearth/10m/cultural/ne_10m_roads_north_america.zip"

@pn.cache
def get_data():
    return gpd.read_file(filename=url, engine="pyogrio")

gdf = get_data()
state_options = sorted(state for state in gdf["state"].unique() if state)

description = """# Lonboard

A Python library for **fast, interactive geospatial data visualization** in Jupyter (and Panel).

By utilizing new technologies like `GeoArrow` and `GeoParquet` in conjunction with GPU-based map rendering, Lonboard aims to enable visualizing large geospatial datasets interactively through a simple interface."""

logo = pn.pane.Image(
    "https://github.com/developmentseed/lonboard/raw/main/assets/dalle-lonboard.jpg"
)

def to_rgb(hex: str) -> list:
    h = hex.strip("#")
    return list(int(h[i : i + 2], 16) for i in (0, 2, 4))

def to_palette(cmap) -> Palette:
    """Returns the ColorCet colormap as a palettable Palette"""
    colors = [to_rgb(item) for item in cmap]
    return Palette(name="colorcet", map_type="colorcet", colors=colors)

class StateViewer(pn.viewable.Viewer):
    value: Map = param.ClassSelector(class_=Map, doc="The map object", constant=True)
    state: str = param.Selector(default="California", objects=state_options)
    cmap: str = param.Selector(default=cc.fire, objects=cc.palette, label="cmap by Colorcet")
    alpha: float = param.Number(default=0.8, bounds=(0, 1))

    data = param.DataFrame()

    def __init__(self, **params):
        params["value"] = params.get("value", Map(layers=[], view_state={"longitude": -119.81446785010868, "latitude": 36.08305565437565, "zoom": 5}))

        super().__init__(**params)

        self.value.layout.width=self.value.layout.height="100%"

        self.description = pn.Column(pn.pane.Markdown(description, margin=5), logo)
        self.settings = pn.Column(
            pn.widgets.Select.from_param(self.param.state, sizing_mode="stretch_width"),
            pn.widgets.ColorMap.from_param(
                self.param.cmap,
                ncols=3,
                swatch_width=100,
                name="cmap by Colorcet",
                sizing_mode="stretch_width",
            ),
            pn.widgets.FloatSlider.from_param(
                self.param.alpha, sizing_mode="stretch_width"
            ),
            margin=5,
            sizing_mode="fixed",
            width=300,
        )
        self.view = pn.Column(
            self._title, pn.pane.IPyWidget(self.value, sizing_mode="stretch_both")
        )
        self._layout = pn.Row(
            pn.Column(self.settings, sizing_mode="fixed", width=300),
            self.view,
            sizing_mode="stretch_both",
        )

    def __panel__(self):
        return self._layout

    @param.depends("state", watch=True, on_init=True)
    def _update_data(self):
        self.data = gdf[gdf["state"] == self.state]

    def _get_color(self):
        palette = to_palette(self.cmap)
        normalized_scale_rank = (self.data["scalerank"] - 3) / 9
        return apply_continuous_cmap(normalized_scale_rank, palette, alpha=self.alpha)

    @param.depends("data", watch=True)
    def _update_value(self):
        layer = PathLayer.from_geopandas(self.data, width_min_pixels=0.8)
        layer.get_color = self._get_color()
        self.value.layers = [layer]
        self._fly_to_center()

    def _fly_to_center(self):
        computed_view_state = compute_view(self.value.layers)
        self.value.fly_to(
            **computed_view_state,
            duration=1000,
        )

    @param.depends("cmap", "alpha", watch=True)
    def _update_layer_get_color(self):
        self.value.layers[0].get_color = self._get_color()

    @param.depends("state")
    def _title(self):
        return f"# North America Roads: {self.state}"

viewer = StateViewer()
pn.template.FastListTemplate(
    logo="https://panel.holoviz.org/_static/logo_horizontal_dark_theme.png",
    title="Works with Lonboard",
    sidebar=[viewer.description, viewer.settings],
    main=[viewer.view],
    main_layout=None,
).servable()