GeoPandas
GeoPandas extends the Pandas data frame library to allow spatial operations on geospatial data.
You can pass an GeoPandas GeoDataFrame into the top-level viz function to quickly inspect data.
Additionally, all relevant Lonboard layer classes have a from_geopandas method for GeoDataFrame input. Some layer types, such as BitmapLayer, don't have a from_geopandas method because the rendering isn't relevant to GeoPandas (i.e. GeoPandas doesn't store image data).
Example
Quickly inspecting data with viz:
import geodatasets
import geopandas as gpd
from lonboard import viz

# New York City boroughs
gdf = gpd.read_file(geodatasets.get_path('nybb'))
viz(gdf)
Customizing display with a Layer constructor:
import geodatasets
import geopandas as gpd
from lonboard import Map, PolygonLayer

# New York City boroughs
gdf = gpd.read_file(geodatasets.get_path('nybb'))
# See PolygonLayer documentation for all rendering parameters
layer = PolygonLayer.from_geopandas(
    gdf,
    get_fill_color=[255, 0, 0],
)
m = Map(layer)
m
We can also pass a column of data into any rendering parameter that starts
with get.
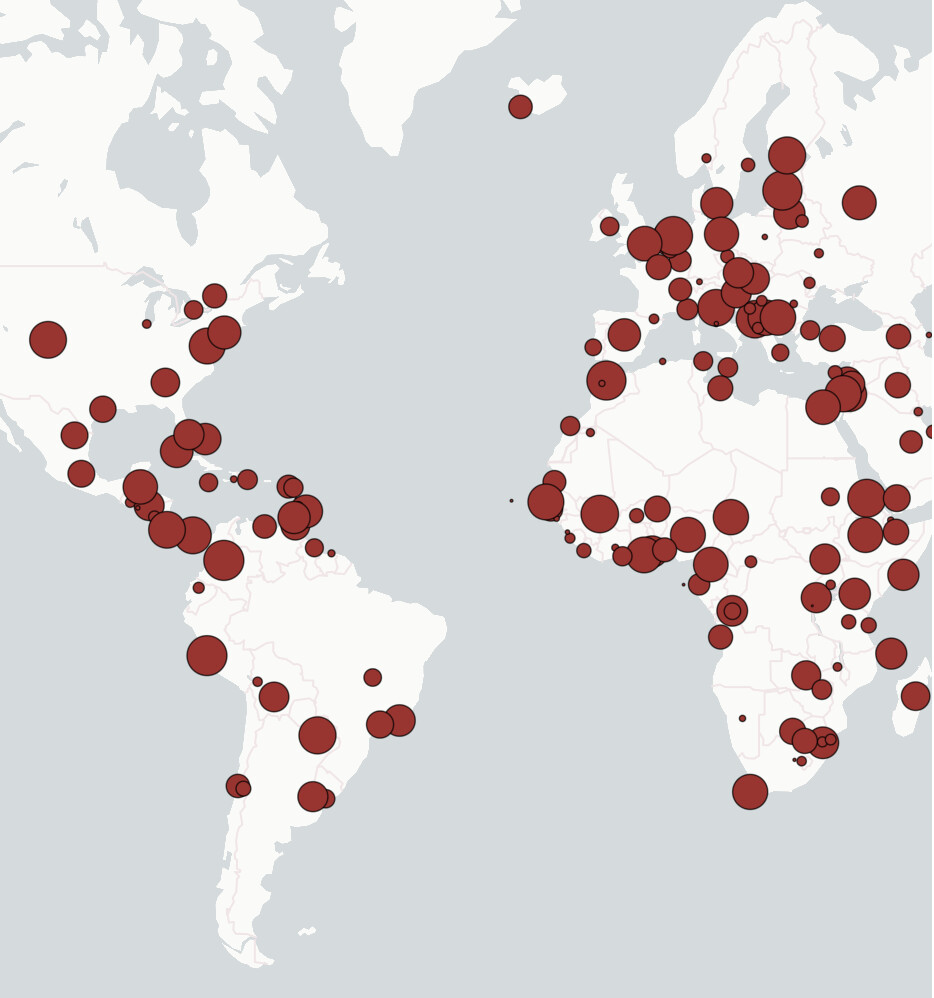
For example, we can render a random radius for each point in this
ScatterplotLayer by constructing an array with the same number of rows and
passing it into get_radius.
import geopandas as gpd
import numpy as np

from lonboard import Map, ScatterplotLayer

gdf = gpd.read_file(gpd.datasets.get_path("naturalearth_cities"))
radii = np.random.random(len(gdf))
layer = ScatterplotLayer.from_geopandas(
    gdf,
    get_fill_color="brown",
    get_line_color="black",
    get_radius=radii,
    line_width_min_pixels=0.5,
    radius_scale=10,
    radius_units="pixels",
    stroked=True,
)
m = Map(layer)
m
A random radius per point: