Rendering Options
When using Titiler to visualize imagery, there are some helper options that change how the data appears on the screen. You can:
- Adjust band values using basic color-oriented image operations
- Apply color maps to create heat maps, colorful terrain based on band value
- Rescale images on a per-band basis
Color Map
Color maps are arrays of colors, used to map pixel values to specific colors. For example, it is possible to map a single band DEM, where pixel values denote height, to a color map which shows higher values as white:
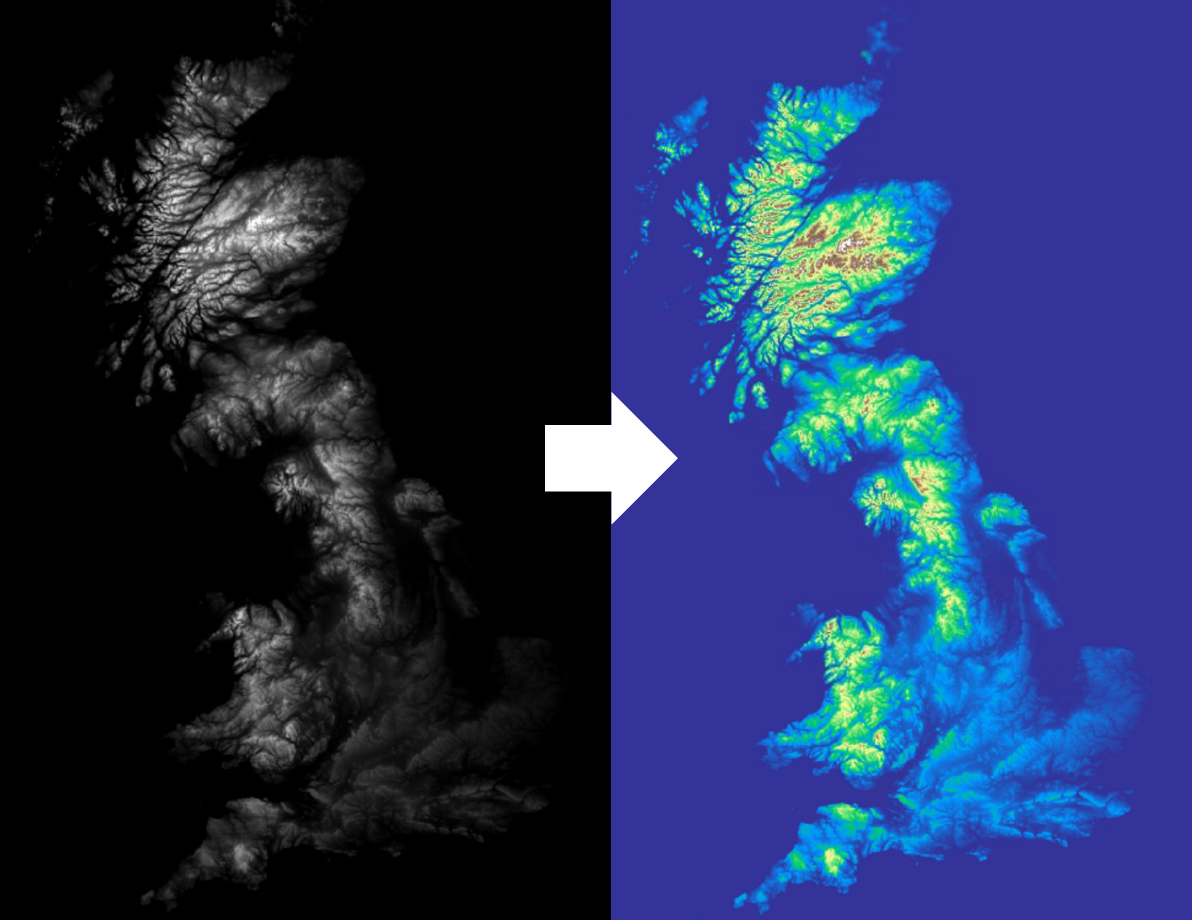
Titiler supports both default colormaps (each with a name) and custom color maps.
Default Colormaps
Default colormaps pre-made, each with a given name. These maps come from the rio-tiler library, which has taken colormaps packaged with Matplotlib and has added others that are commonly used with raster data.
A list of available color maps can be found in Titiler's Swagger docs, or in the rio-tiler documentation.
To use a default colormap, simply use the parameter colormap_name:
import httpx

resp = httpx.get(
    "https://titiler.xyz/cog/preview",
    params={
        "url": "<YOUR DATASET URL HERE>",
        "colormap_name": "<YOUR COLORMAP NAME HERE>" # e.g. autumn_r
    }
)
You can take any of the colormaps listed on rio-tiler, and add _r to reverse it.
Custom Colormaps
If you'd like to specify your own colormap, you can specify your own using an encoded JSON:
import httpx

response = httpx.get(
    "https://titiler.xyz/cog/preview",
    params={
        "url": "<YOUR DATASET URL HERE>",
        "bidx": "1",
        "colormap": json.dumps({
            "0": "#e5f5f9",
            "10": "#99d8c9",
            "255": "#2ca25f",
        })
    }
)
Titiler supports colormaps that are both discrete (where pixels will be one of the colors that you specify) and linear (where pixel colors will blend between the given colors).
For more information, please check out rio-tiler's docs.
It is also possible to add a colormap dependency to automatically apply a default colormap.
Color Formula
Color formulae are simple commands that apply color corrections to images. This is useful for reducing artefacts like atmospheric haze, dark shadows, or muted colors.
Titiler supports color formulae as defined in Mapbox's rio-color plugin. These include the operations (taken from the rio-color docs):
-
Gamma adjustment adjusts RGB values according to a power law, effectively brightening or darkening the midtones. It can be very effective in satellite imagery for reducing atmospheric haze in the blue and green bands.
-
Sigmoidal contrast adjustment can alter the contrast and brightness of an image in a way that matches human's non-linear visual perception. It works well to increase contrast without blowing out the very dark shadows or already-bright parts of the image.
-
Saturation can be thought of as the "colorfulness" of a pixel. Highly saturated colors are intense and almost cartoon-like, low saturation is more muted, closer to black and white. You can adjust saturation independently of brightness and hue but the data must be transformed into a different color space.
In Titiler, color_formulae are applied through the color_formula parameter as a string. An example of this option in action:
import httpx

response = httpx.get(
    "https://titiler.xyz/cog/preview",
    params={
        "url": "<YOUR DATASET URL HERE>",
        "color_formula": "gamma rg 1.3, sigmoidal rgb 22 0.1, saturation 1.5"
    }
)
Rescaling
Rescaling is the act of adjusting the minimum and maximum values when rendering an image. In an image with a single band, the rescaled minimum value will be set to black, and the rescaled maximum value will be set to white. This is useful if you want to accentuate features that only appear at a certain pixel value (e.g. you have a DEM, but you want to highlight how the terrain changes between sea level and 100m).
All titiler endpoinds returning image support rescale parameter. The parameter should be in form of "rescale={min},{max}".
import httpx

response = httpx.get(
    "https;//titiler.xyz/cog/preview",
    params={
        "url": "<YOUR DATASET URL HERE>",
        "rescale": "0,100",
    },
)
Titiler supports rescaling on a per-band basis, using multiple rescale parameters.
import httpx

response = httpx.get(
    "https;//titiler.xyz/cog/preview",
    params=(
        ("url", "<YOUR DATASET URL HERE>"),
        ("rescale", "0,100"),
        ("rescale", "0,1000"),
        ("rescale", "0,10000"),
    ),
)
By default, Titiler will rescale the bands using the min/max values of the input datatype. For example, PNG images 8- or 16-bit unsigned pixels, giving a possible range of 0 to 255 or 0 to 65,536, so Titiler will use these ranges to rescale to the output format.
For certain datasets (e.g. DEMs) this default behaviour can make the image seem washed out (or even entirely one color), so if you see this happen look into rescaling your images to something that makes sense for your data.
It is also possible to add a rescaling dependency to automatically apply a default rescale.