


Open-source technology is in our DNA. One of the things we love most about open-source is the communities that spring up around different efforts. Our team is passionate about supporting people and organizations who use, contribute to, or help build open-source tools. We strongly believe in the power of open-source technology to create an even playing field and grow the Earthdata ecosystem.
We want to highlight our favorite open-source tools, projects, and libraries. Exploring some of these applications and learning more about their implementation will be fun. We hope you find it interesting!
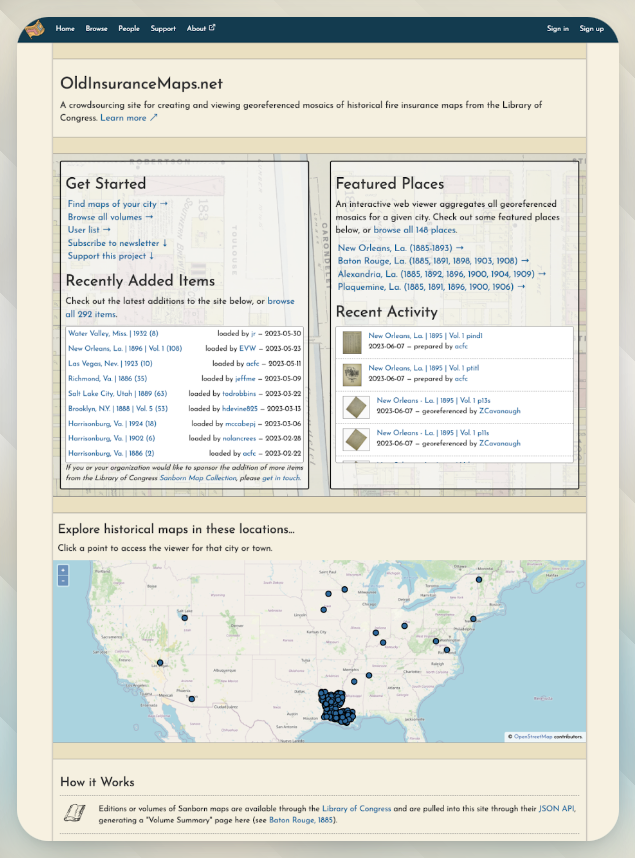
The first project we’d like to share is OldInsuranceMaps.net, created by Adam Cox. Learn how this groundbreaking open-source project breathes new life into historical Sanborn maps through collaborative georeferencing. Uncover this initiative's story, evolution, and potential to transform spatial analysis and engagement with historical data. Georeferencing of historical maps, particularly Sanborn maps, makes them accessible, usable, and interactive in modern GIS systems. The availability of georeferenced historical maps often limits projects like OpenHistoricalMap. These maps hold invaluable insights, but their potential is often untapped due to the lack of georeferencing. Adam is trying to change this by creating a public space for anyone to participate in a structured, browser-based workflow designed specifically around these historical fire insurance maps.
Tell Us About This Project and Why You Started It
I wanted to create a collaborative space for georeferencing historical maps, especially multi-page atlases, to turn them into publicly accessible mosaic layers. My idea wasn't new – check out MapWarper, Georeferencer, or the development of AllMaps, for example – but I focused specifically on the Library of Congress' digital Sanborn Map Collection, a fascinating collection of historical maps. Not only does crowdsourcing distribute the work of georeferencing historical maps, but it also provides a new way for people to engage with them. This historical archive covers over 8,000 cities, towns, and villages across North America, so I felt that building a project around it would create something many people could connect to.
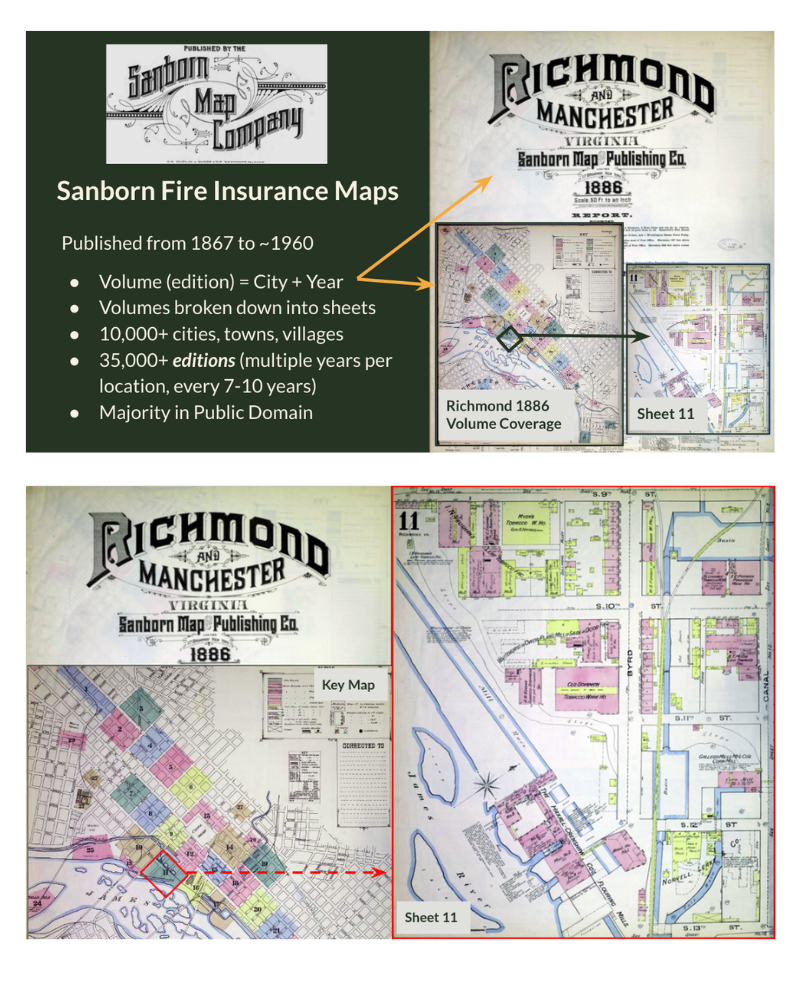
Sanborn Maps
The Sanborn Map Company created these maps between the 1860s and 1960s to help fire insurance underwriters balance their risk. They show building footprints, uses, and construction materials, focusing on commercial and industrial areas. The Library of Congress has the most extensive public archive of these maps. Through a massive digitization effort, there are now 35,000 digitized editions available online, and a JSON API makes it easy to access this content. It is an unparalleled, large-scale, and enthralling visual record of urban and architectural development around the turn of the century.
Researchers use these maps all the time, but to perform meaningful spatial analysis with them, each sheet must be georeferenced–rotated, warped, and embedded with geospatial coordinates–turning a scanned document into a Cloud Optimized GeoTIFF (COG). As the project evolved, I focused on creating an easy-to-use browser interface and exposing these historical maps to the public at every stage with a robust, iterative workflow.
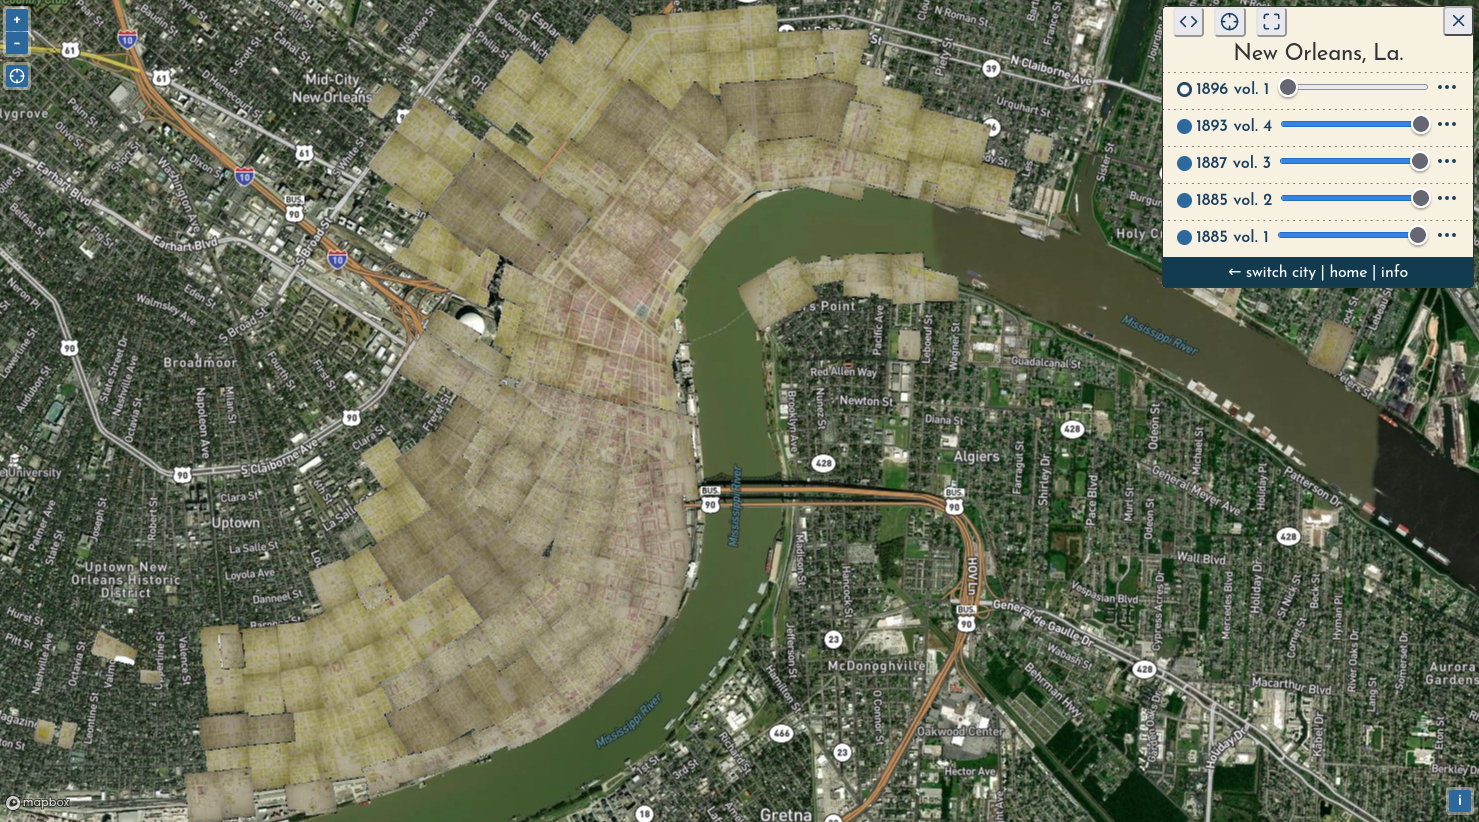
New Orleans, LA
From February through May last year, I facilitated a public participation period including only maps of Louisiana, where I live. A few dozen people participated (with a small proportion doing the vast majority of the work, not uncommon in crowdsourcing), and they georeferenced over 1,500 layers from 270 different atlas editions covering 140 cities and towns. Of course, we worked on the largest city in the state, New Orleans. Link to interactive viewer.
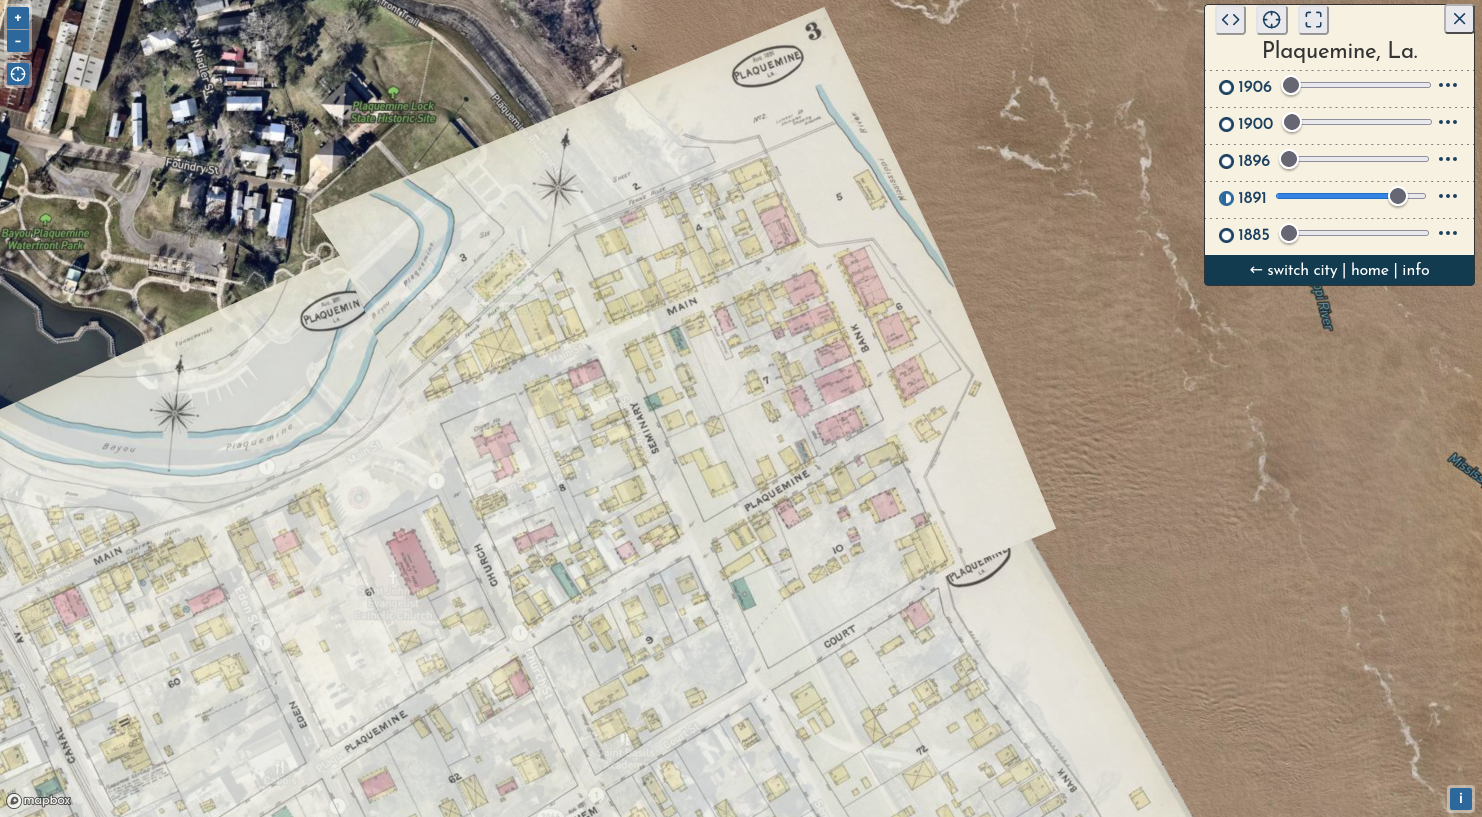
Plaquemine, LA
But people also added and georeferenced small towns they were interested in seeing through time, like Plaquemine, where, over the years, the Mississippi River has slowly carved away a few blocks of the downtown. Link to this exact view.
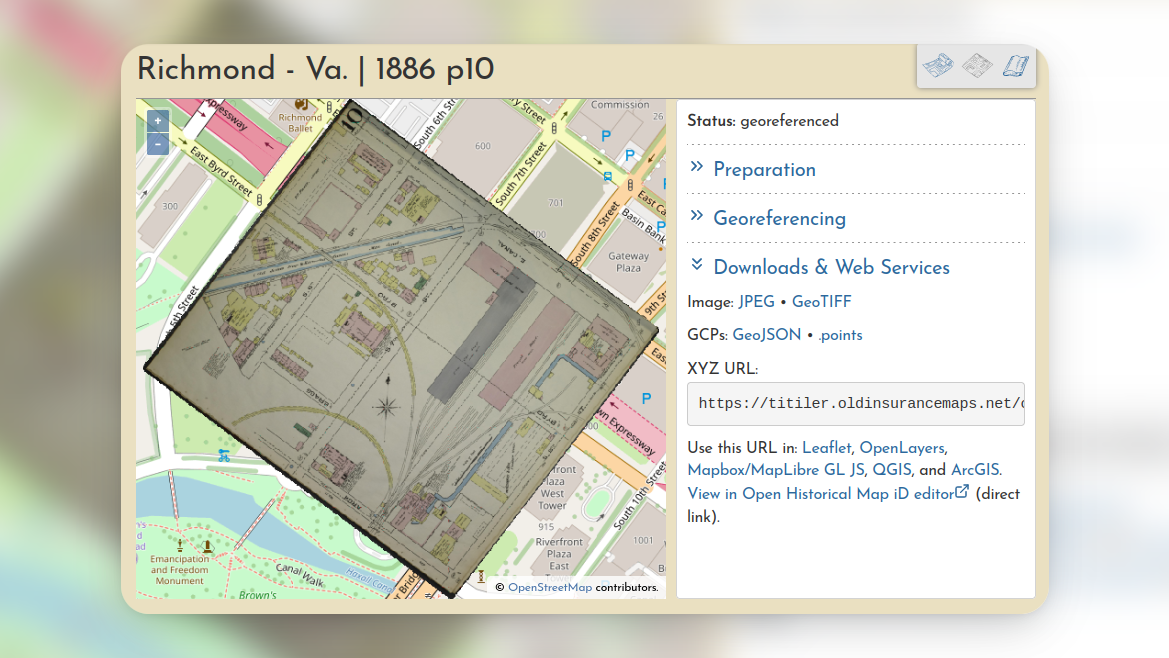
Example of the georeferencing interface. After three control points have been created, a live preview (rendered by TiTiler) shows the georeferenced results.
What is the stack?
The software stack has evolved since I started in 2019. Initially, I structured it as an extension of the open-source geospatial content management system GeoNode. The idea was that GeoNode, integrated with GeoServer, would provide the GIS backend and content management. I would inject a browser-based georeferencing interface and scaffolding to handle the multi-page Sanborn map editions.
This approach worked well enough through the public pilot project, but by the end of last summer, some cracks were beginning to show in my design. Also, significant work would be needed to upgrade my extension to the new 4.0 release of GeoNode, so I started a slow but now complete effort to completely overhaul the app and turn it into a standalone platform.
Today, OldInsuranceMaps.net is a Django application with the following components:
- Svelte, OpenLayers+ ol-ext (frontend)
- Postgres +PostGIS, GDAL (database and spatial operations)
- Celery/RabbitMQ (background processes)
- TiTiler (dynamic raster tiling)
Why dynamic tiling?
I first heard about TiTiler from a friend at Princeton University Libraries, where they have been using it to serve their map series mosaics. Because I was creating GeoTIFFs, decoupling the tile server from the content management system and passing file URLs directly to TiTiler was relatively easy. I can even point to an external TiTiler deployment–no need to integrate it with the codebase–which makes (re) deployment very manageable.
Once georeferenced, each layer can be accessed and downloaded in multiple ways. An XYZ or WMS endpoint generated by TiTiler can be used in any common geospatial applications.
Further, I think there is something to be said for handling these particular old maps (drawn very accurately at a large scale) less as historical documents and more like really old aerial imagery–if TiTiler can render NDVI at the point of tile generation, why not try some custom algorithms that would enhance the display of historical maps? Now that I’ve learned more about TiTiler and its broader ecosystem, I think there are many new and interesting ways to apply these tools to georeferenced archival content.
It has also been fun to experiment with TiTiler’s MosaicJSON, which provides a single XYZ endpoint that can pull from any number of source files–no need to merge them into a single COG. This is especially helpful with these large, multi-page atlases where the margins of adjacent sheets must be trimmed to create a seamless mosaic. To facilitate this, I created a “MultiMask” trimming interface; users clip each layer, and then MosaicJSON can stitch them all together.
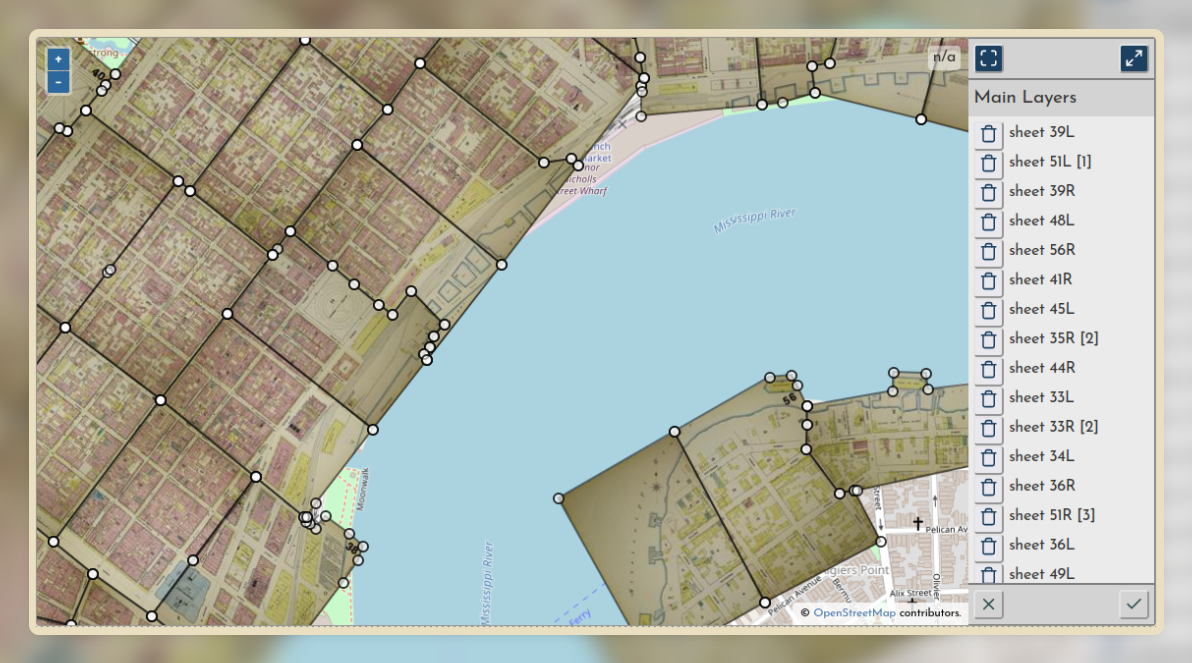
The “MultiMask” interface eases the creation of contiguous cutlines for individual sheets across a volume.
What's Next
While this project started as a proof-of-concept for my thesis, I’ve continued to improve it over the last year, and the site is seeing a lot of interest from various people. For example, the georeferenced maps served (via TiTiler) as tiles can now be incorporated into other web mapping applications, like OpenHistoricalMap, an OpenStreetMap-inspired project where contributors map historical features (buildings, roads, etc.) instead of current ones. On OldInsuranceMaps.net, I’ve added a shortcut to open any georeferenced map (or mosaic for an entire city if it’s been completed) directly as a basemap in the OHM editor, easing the process of digitizing features from these maps. Check out my talk with Jeff Meyer at State of the Map US 2023. There is a lot of potential for this workflow to be improved, too, with the various feature extraction pipelines that get better every day.
On the community engagement side, a group at the University of Richmond Digital Scholarship Lab has begun using the site for a massive georeferencing effort they are undertaking as part of an NIH grant in partnership with the University of Michigan and the National Community Reinvestment Coalition. Their aim is to create open data resources to aid research into the impact of place-based systemic racism, and part of doing so involves georeferencing Sanborn maps from the 1940s-50s of 50 American cities with a history of redlining. Already students are using the platform daily, working on cities like Sacramento, Birmingham, Miami, and many others (with more to come!).
Other partnerships are in the works, so the best way to stay current is to join the newsletter or follow development on GitHub.
What we're doing.
Latest