Using new satellite imagery sources and machine learning to predict crop types in challenging…
- Estimated
- 7 min read
Building tools to help small-scale farmers connect to the global economy
Accurate, in-season estimates of crop extent and yield would be useful to a variety of audiences including governments, development agencies, and various organizations along agricultural value chains. Ultimately, knowing where crops are and how well they are performing will be critical in the development of insurance and financial services products for small-scale agriculturalists in developing countries. In partnership with the Earth on AWS fellowship program and using the Earth on AWS platform, along with some of the tools Development Seed has built to easily access and analyze satellite imagery, I’ll be exploring a unique approach to crop classification in developing countries.
Predicting where specific crops are being grown in a current growing season using satellite imagery presents many unique challenges. Unlike roads and buildings, a crop’s appearance changes throughout the year. Even with very high-resolution satellite imagery, it can be difficult to identify specific crop types by eye. The challenge is even greater in developing countries in which field sizes are generally small; even moderate-resolution satellites like Landsat may not be able to distinguish individual fields in certain regions. The difficulty increases in areas producing many crops over a small area. Unlike, for example, the midwest United States where the agricultural landscape is dominated by corn and soybeans, it is not uncommon to see 10 or more different crops growing in the same area in places like Southeast Asia and Sub-Saharan Africa. Perhaps the biggest obstacle, however, is the general lack of “ground-truth” data (outside of the U.S. and Europe) of known locations were specific crops are being grown.
Development Seed wants to push the conversation and build tools to address some of the challenges in crop classification in developing countries. Specifically, we’ll test an alternative approach to generating training data for a supervised classification model in order to overcome the ground-truth data problem. We’ll use Sentinel-2 images which have both high spatial resolution (10 m for certain bands) and revisit rate (approximately every 5 days) to group pixels based on how they change over the growing season. We’ll then dig deeper into patterns of these pixel groups and label them as specific crop types (with a focus on maize) based on the regional cropping calendar, and on domain-specific knowledge of how certain crops change throughout the year. After a group has been labeled, those pixel locations can then be used to generate training data for a supervised classification model.
We will test these methods in Tanzania as a proof-of-concept. Tanzania was selected because it has a relatively simple crop mix dominated by maize, and because a large portion of agriculturalists in the region depend on maize as a major income source. This post outlines our proposed methodology for this problem, and the outputs we hope to generate. A broader goal of this project is to provide an open and transparent view to into our process, the inevitable pitfalls, and the course corrections we make along the way. We encourage those who are interested to follow along and provide input and insights throughout.
Phase 1: Area of Interest (AOI) identification and NDVI time-series extraction
Rukwa, Tanzania is an AOI because it:
-
Is an important maize producing region both in terms of its proportion of Tanzania’s total maize area (~5% in 2014/15) and the number of farmers growing maize
-
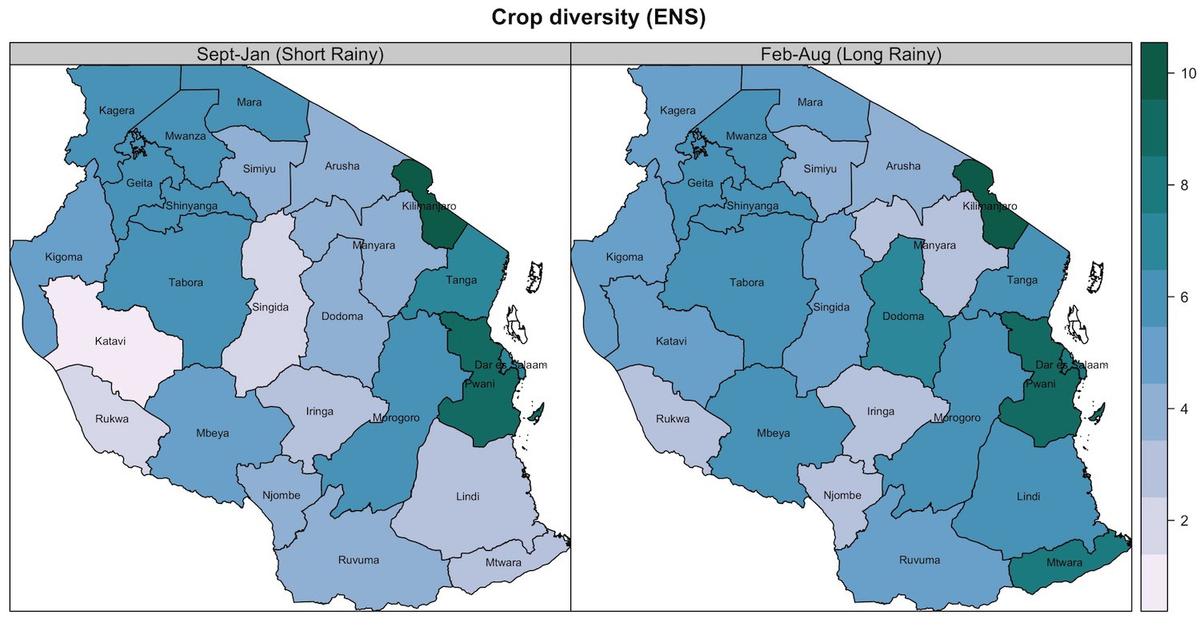
Has low crop species diversity during the maize growing season, hopefully allowing for easier cluster labeling
-
Has a single maize growing season corresponding to the unimodal rainy season in the Southern Highlands of Tanzania
 Effective number of crop species (ENS) in Tanzania, 2014/15 growing season (Data.) ENS is a diversity metric that can be interpreted as follows: a value of X is the equivalent of X species occupying the same area.
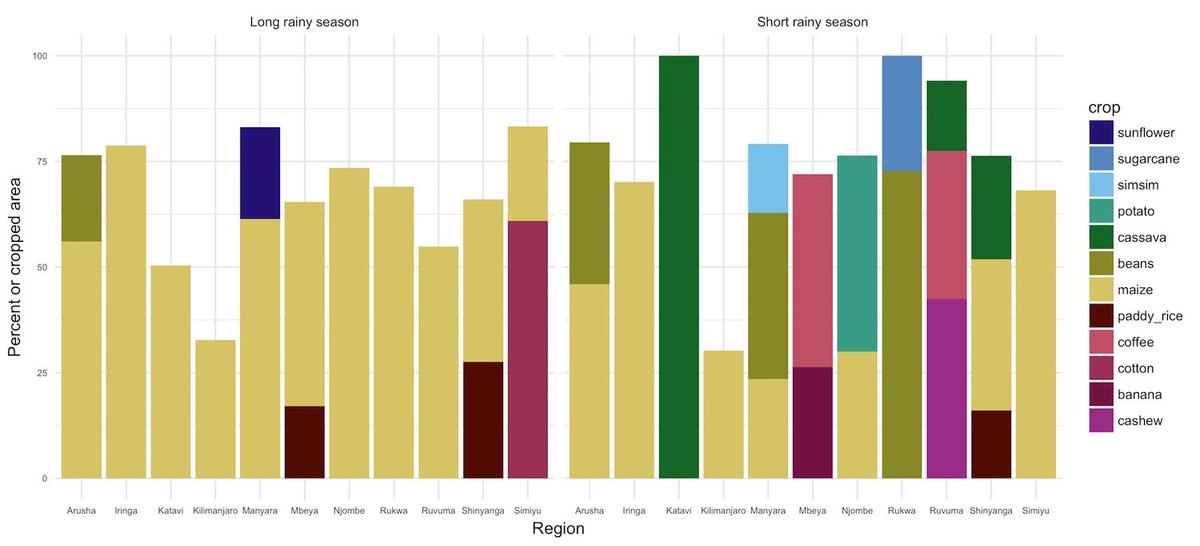
Cropped area in Rukwa is dominated by maize for the primary growing season which spans from November/December through June/July, which may allow for easier cluster labeling:
 Percent of cropped area dedicated to major crops in Tanzania regions in 2014/15 (Data). Rukwa cropped area is comprised of nearly 75% maize during the “long” rainy season
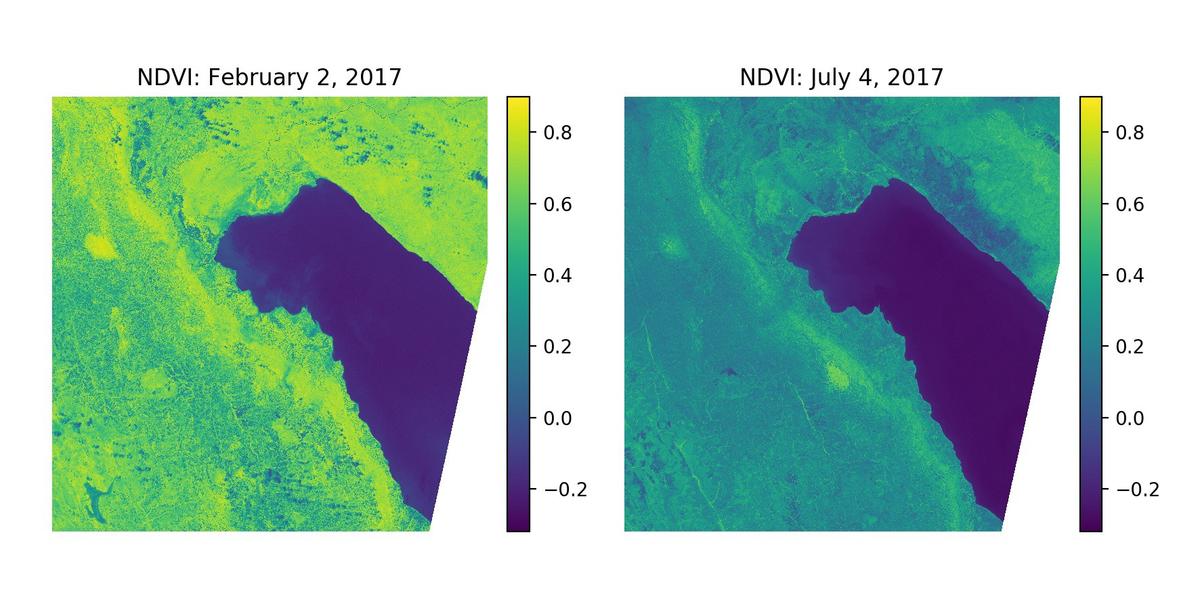
To test the above approach, we’ll generate a time-series of NDVI layers from a Sentinel-2 tile with a variety of land cover classes including water, urban area, cropped area, and various vegetation classes. NDVI is an indicator of vegetative growth — low NDVI values correspond to a lack of green vegetation (e.g. a field immediately after planting); high values correspond to a dense, green canopy. First, we’ll select a series of scenes with <15% cloud cover using the EO Browser tool from Sentinel-Hub. To ensure a representative sampling of land cover classes, we will manually generate polygons corresponding to these generic land cover categories using QGIS and rasterize them, allowing for the generation of land cover masks and the extraction pixel-wise NDVI time-series’ for an arbitrary number of samples.
 NDVI in Rukwa Region, Tanzania (near Sumbawanga) derived from Sentinel 2 tiles
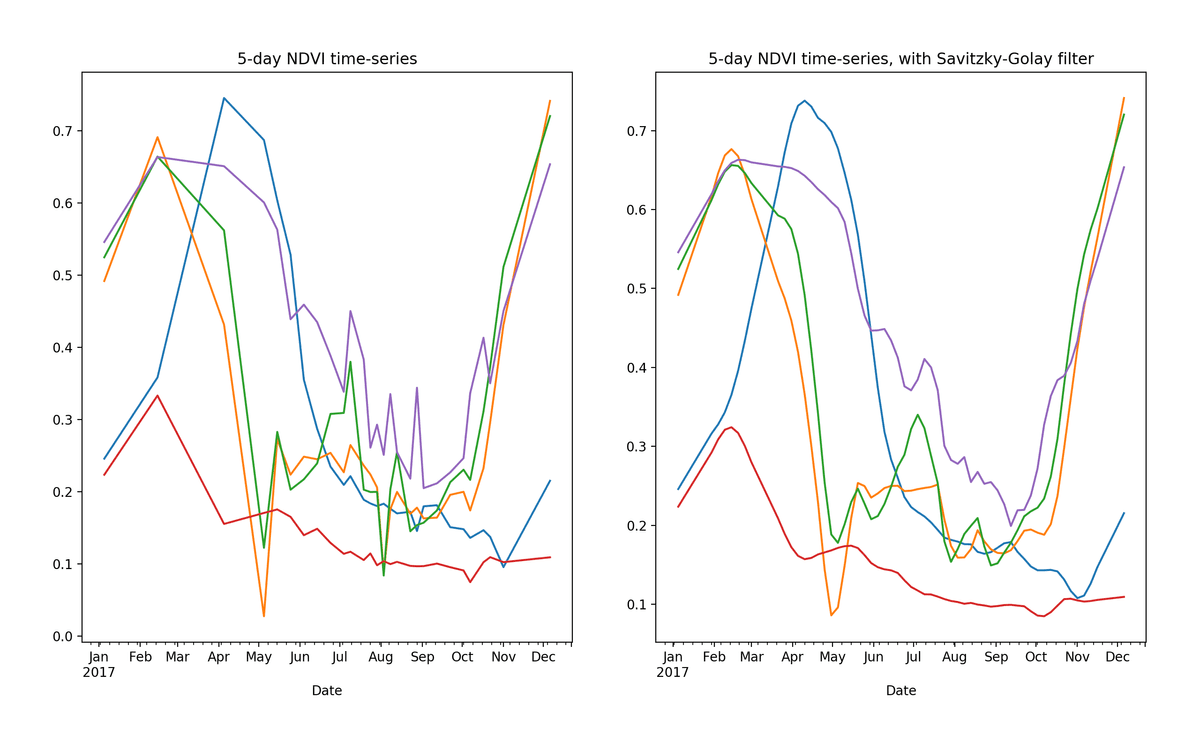
Finally, we will linearly interpolate each NDVI time-series to a 5-day interval for 2017, matching the Sentinel-2 revisit rate.
We will also explore the impact of smoothing the NDVI time-series (to reduce noise from various sources) on the clustering output.
 Raw (left) and smoothed (right) 5-day NDVI time-series extracted from 5 random pixels in cropped area of Rukwa Region, Tanzania. 5-day time-series for 2017 were generated by performing linear interpolation on values extracted from 28 low-cloud (<15%) Sentinel-2 tiles.
Phase 2: NDVI time-series clustering
Conventional dissimilarity measures like euclidian distance do not perform well when clustering time-series data. For example, two time-series of the same class, e.g. two sin curves with distinct transformations, can have a large euclidian distance between them. This would present problems, for example, when measuring distance between two maize fields planted at different dates. Ideally, the clustering algorithm should be able to group NDVI curves associated with the same crop despite differences in planting/harvesting date, or subtle differences in NVDI values over the growing season.
Enter: Dynamic Time Warping (DTW). Unlike euclidian distance, DTW finds the optimal (non-linear) alignment between two curves, resulting in less pessimistic distance measures between transformed curves of the same class. The resulting distance matrix can then be used as an input to various unsupervised learning algorithms like k-means.
After clustering, we will examine various characteristics of the resulting groups, including timing of peak NDVI, and the apparent planting and harvest dates, and attempt to label them as specific crop classes based on the cropping calendar in the region. There are sure to be hurdles here. Within-crop NDVI may vary considerably across space due to changes in soil types, climate, or other biophysical factors, and/or agronomic practices such as nutrient application or intercropping. There is also a possibility that different crops will exhibit very similar NDVI curves, limiting out ability to effectively label clusters.
Phase 3: Supervised classification
If we are able to confidently label one or more clusters, we can use the labeled pixels as locations for generating a training data set for a supervised classification model. At each pixel location, we will extract reflectance values from multiple Sentinel-2 bands as well as various indices generated from these bands (including NDVI) for the full time-series.
Training a sequential classification model, e.g. an LSTM recurrent neural network, is a potentially exciting avenue to pursue. Reflectance time-series curves are inherently sequential, making them natural candidates for such a model. Using a recurrent model structure, we could test classification accuracy using reflectance data from an arbitrary number of time steps, e.g. for the first few months of the growing season. In this way, we could test the feasibility of predicting the spatial extent of important crops during the current growing season without the need for ground-truth data for training our models.
Conclusion
It is our hope that this effort will contribute to the development of easy to use tools for practitioners in the agricultural development space. Helping small-scale farmers connect to an increasingly global economy is challenging. Knowing where specific crops are being grown in “real-time” will be a critical piece of the puzzle. We believe that satellite imagery can help in the development of this toolkit, and we’re eager to drive the conversation.
What we're doing.
Latest
