

The housing crisis deeply impacted millions of Americans, and today the effects are still being felt. For the many problems facing communities, from wage disparity to affordable housing, there isn’t a single fits-all solution.
That’s why we are very excited about the work that Woodstock Foundation is doing to support fair housing policies. Today they launch a nuanced look at housing and income disparity in Illinois in the form of a new map-based open data website.
The site brings together 74 datasets on the well-being of local communities. It is a good roadmap for anyone working in housing justice in Illinois. Community organizations can explore the average amount of mortgage debt people take on and the rate of foreclosure filings in the Chicago six-county region and elsewhere in Illinois to inform their decisions on where to focus their work. Some data sets go back to 2008.
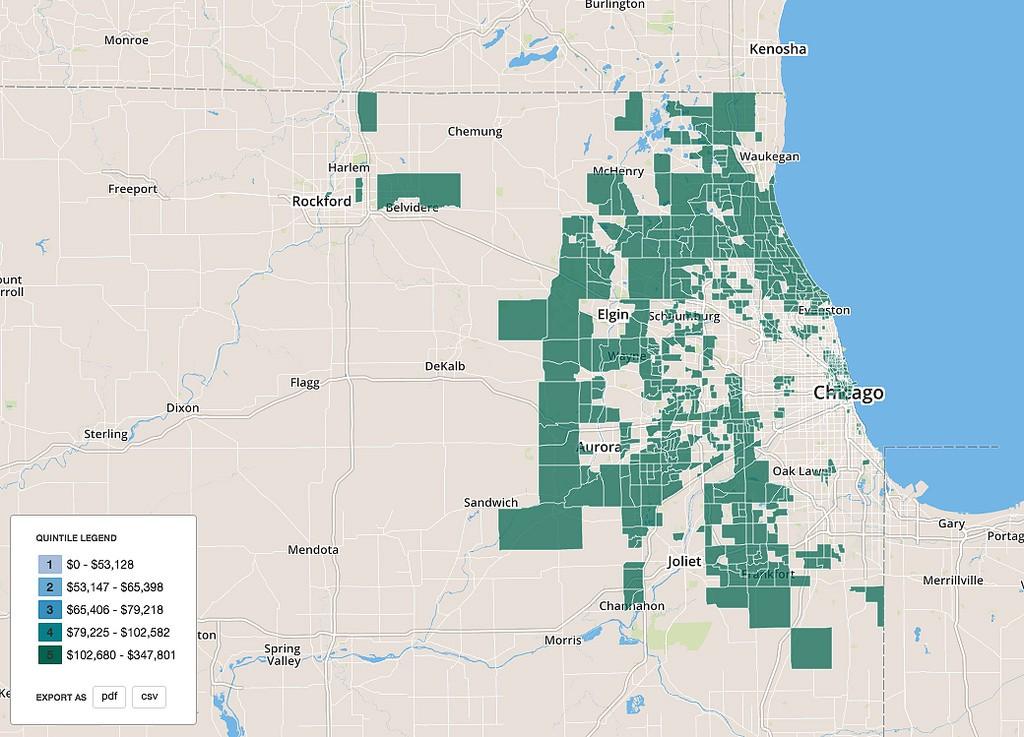
Where the highest income census tracts are in the Chicago six-county region
Serving complex data through static JSON
Housing data is complex, and Woodstock has gathered some amazingly granular statistics about housing data in Illinois. Splitting this data into a format that we could serve over the web proved a difficult challenge. Woodstock is also a small nonprofit, and we wanted to ease as much as possible the burden of maintaining a complicated website.
So we wrote a python library to break up their spreadsheets into JSON. Every time you switch to a new facet of housing data, every time you view a different year or category of that data, your browser incrementally downloads a new JSON file. Although those files in aggregate would take ages to load, individually they are manageable. Those scripts, along with the rest of the site, are open-source.
To further reduce load times, we use the topojson spec to reduce the size of geographic boundary data. This allows us to separate geographic data from numerical data, so you only download those complex census tract boundaries once. The code that runs in your browser than re-connects those boundaries to the housing or mortgage data you select on the fly.
Using vector-based geographical boundaries has other benefits. It allowed us to use a mouse click on an overlaying geographic boundary and a point-in-polygon test to find, for example, which congressional representative is responsible for which census tract.
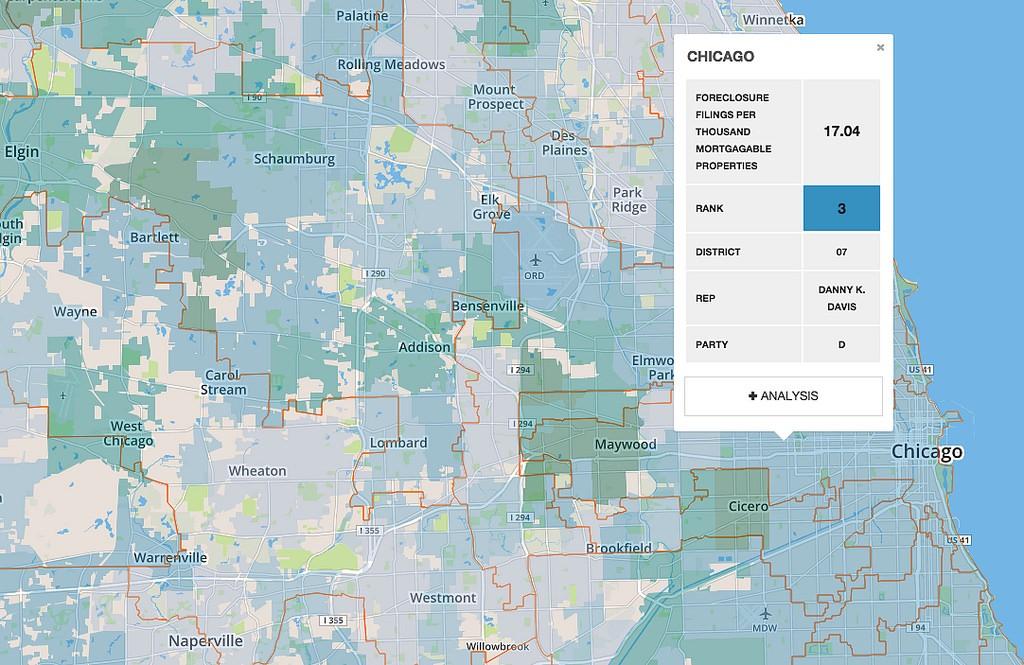
Detecting congressional boundaries
Census tracts over multiple years
Census tracts change a lot over census years, and this can be a problem when mapping a multi-year data set that covers more than a single census geography file. Attempting to compare the data between those years that use different tract definitions can be tricky. Tract ID, or FIPS codes can either refer to a different neighborhood or disappear entirely.
The Census releases relationship files that show where these changes and additions occur. Using this, we created a tool that overlays 2000 and 2010 census tracts, and shows differences between the two years.
Currently the project covers only Illinois, but the code is available on GitHub and ready for you to fork and contribute your own state.
What we're doing.
Latest