

A snapshot of our experimental tools and open-source innovations, showcasing the projects that drive our curiosity forward.

Welcome back to Groundwork, our occasional roundup of experiments, prototypes, and open-source projects from across Development Seed.
Some of these projects may evolve into production tools. Others help us test ideas, learn something new, or contribute back to the communities and ecosystems we rely on every day.
In this edition, we're exploring new ways to build reliable AI agents for geospatial analysis, use natural language to navigate satellite imagery, and visualize multidimensional forecast data directly in the browser. We're also sharing new tools for validating STAC GeoParquet data and updates that make eoAPI easier to deploy and maintain in production.
Across these projects, we're experimenting with ways to make complex geospatial data and workflows more accessible, reliable, and easier to work with.
Driving Maps with System One Models
We experimented with how one could drive maps using natural language, but without a chat. Chat-based agents are great, but sometimes we don't need the conversation. We just want a flash mode: one request that triggers the steps that would normally take a bunch of clicks. Existing agents can be overkill for these interactions, adding latency and cost to what feels like an easy task.
After reading about the new System One class of models such as Jev and Clairic, we saw an opportunity to add prompt-based UI updates to our mapping tools. System One models are not generative. They perform choice and extraction tasks blazingly fast and for a fraction of the cost of an LLM. This can be leveraged to drive mapping interfaces.
We decided to explore this, and the result is stac-zap, an extension of our browser-based STAC visualization tool stac-map.
You type one request in the search bar, for instance “find Swiss orthophotos of Zurich”. Then System One models pick the catalog and the collection, extract the place in your request, and set the dates and the cloud cover where needed. The models we use do not write text: they only select from predefined options or extract information from the prompt. The models can only select real catalogs, collections, and places, so every search is a valid STAC query. The answers update the app state, and stac-map shows the result.
It's a snappy and fun way to interact with maps and data. Try it out!
One request, no chat: stac-zap turns a prompt into a valid STAC search around Cotopaxi.
Exploring Forecast Data in 3D, Right in the Browser
How we visualize geospatial data determines what patterns and insights we actually notice. For example, a top-down geographic view can show where it's warm at a single forecast hour. But if we want to see where heat persists over time, stacking forecast hours into a space-time cube might make more sense. There are several tools that support space-time cubes. We put together an experiment called Zarr SQL Views to explore this concept entirely in the browser.
The experiment uses deck.gl to render a 3D cube with longitude and latitude on the horizontal X and Y axes and forecast (lead) time on the vertical Z axis. On the frontend, Zarrita fetches and decodes Zarr chunks directly from cloud storage, for example, loading the ECMWF AIFS forecast model published by dynamical.org. Once the data is loaded in memory, we can click on any location in the cube and see instant time series. We can also slice the cube or pan to a different region, which sends a signal to the cube to refetch new chunks.
To query the data, we experimented with DuckDB-WASM. Using SQL predicates, we can show where and when temperatures exceed a threshold between specific forecast hours or run more complex queries on the same data. Driving selections with SQL offers full visibility into the cube's filters and makes it easy to tweak predicates on the fly or hand them off to an LLM for refinement.
We're also exploring ways to scale volumetric visualizations beyond the bounded region shown in this experiment.
Try the experiment or explore the repository.
Each layer of the cube is a forecast hour. Slicing it, moving the region, or editing the SQL query updates the view in the browser.
Building More Reliable Geospatial Agents
Building agents is a task that we have done quite a few times over the past two years. In all projects, we have built agents that work with data and where trust and reliability are among the top concerns. We have started to compile our learnings from across projects into a framework called mcp-toolsets-runtime.
The runtime makes it easy to build agents that follow all the best practices we have developed through our project work. The focus is that for new agents, only the agent tools need to be built. The runtime then takes care of packaging tools up in MCP services, connects them to a default agent with an API, and provides a frontend to interact with it. So new agent development can focus on the tooling; everything else has batteries included.
Aside from being a streamlined way to create and deploy agents, the core innovation is the state handling in the runtime. Data analysis agents that handle EO and geo data cannot read the data directly into context. That would be expensive and explode context windows, but it would also break provenance tracking of the data. The runtime solves that problem with a middleware that puts data into a state storage and provides handles to the agent. The agent then works with handles to data, not the data itself. That approach is token efficient and guarantees that data cannot be hallucinated.
We are aware that the agentic world is ever evolving, so we are not sure how long this kind of framework will still be needed. Until now, it has served us well in our work.
Explore the repository or see an example implementation.
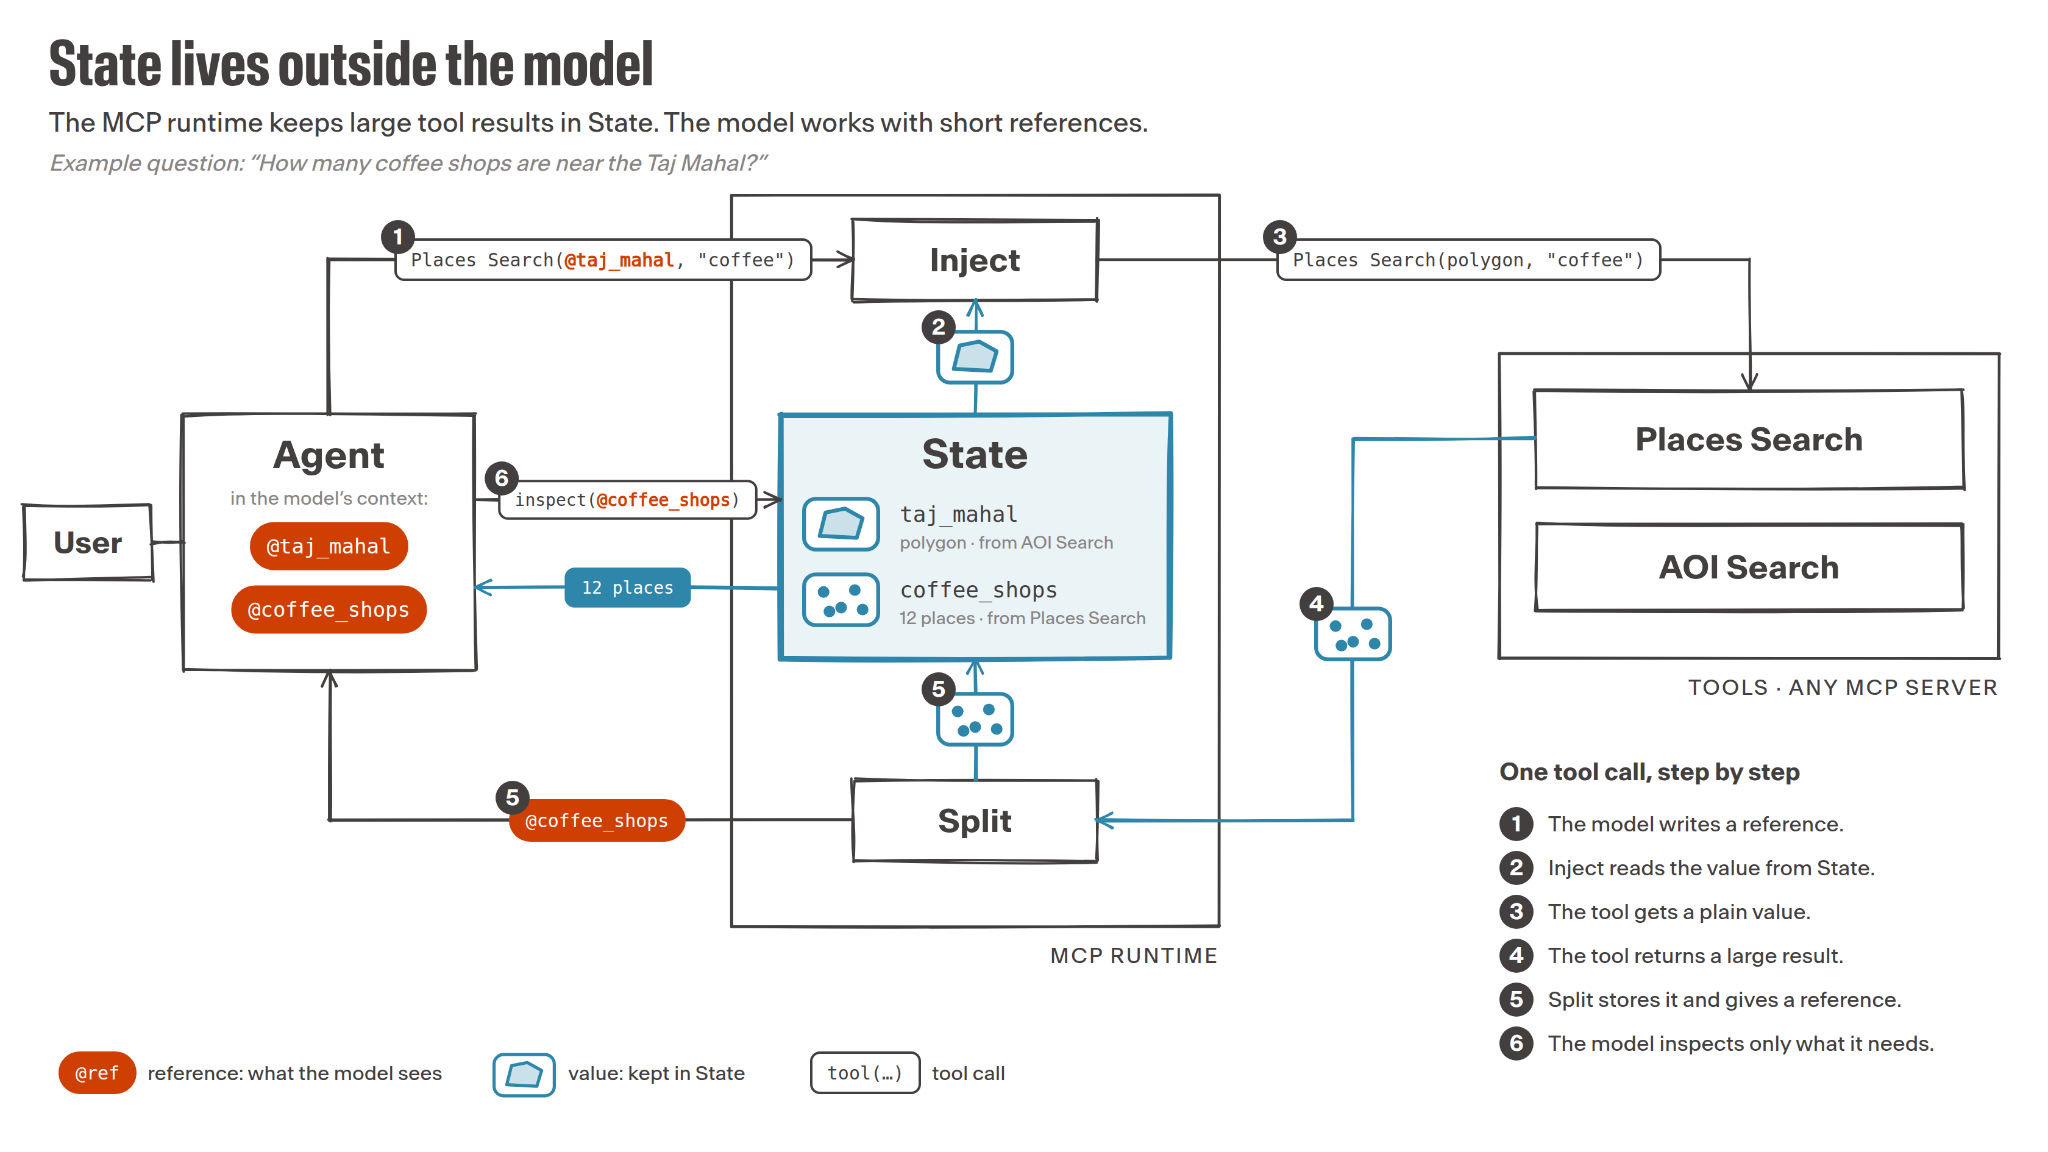
State lives outside the model: the agent works with short references like @taj_mahal and @coffee_shops, while the runtime keeps the actual data in State and swaps it in only when a tool needs it.
Validating STAC GeoParquet Files
As part of our ongoing push into stac-geoparquet, we've created a simple web application and API endpoint for validating stac-geoparquet files against the specification and best practices. Try it out.
We built the checks from the geoparquet and stac-geoparquet repository documentation, and they're documented in the API.
We used code-generating services (Claude Code, in this case) to build our validator's rule set; we asked the service to scan the specifications and best practices, and then to translate those rules into code. We then validated those rules ourselves (human-in-the-loop) and made changes to match our interpretation of those best practices. We then described this process in a simple markdown file, so future changes to the upstream specifications and best practices can be taken up quickly and correctly.
Speed isn't always the goal, but automation like this can be the difference between something happening or it being left on the "to do" list. We'll be using this pattern (converting best practices to code, with human curation) more in the future!
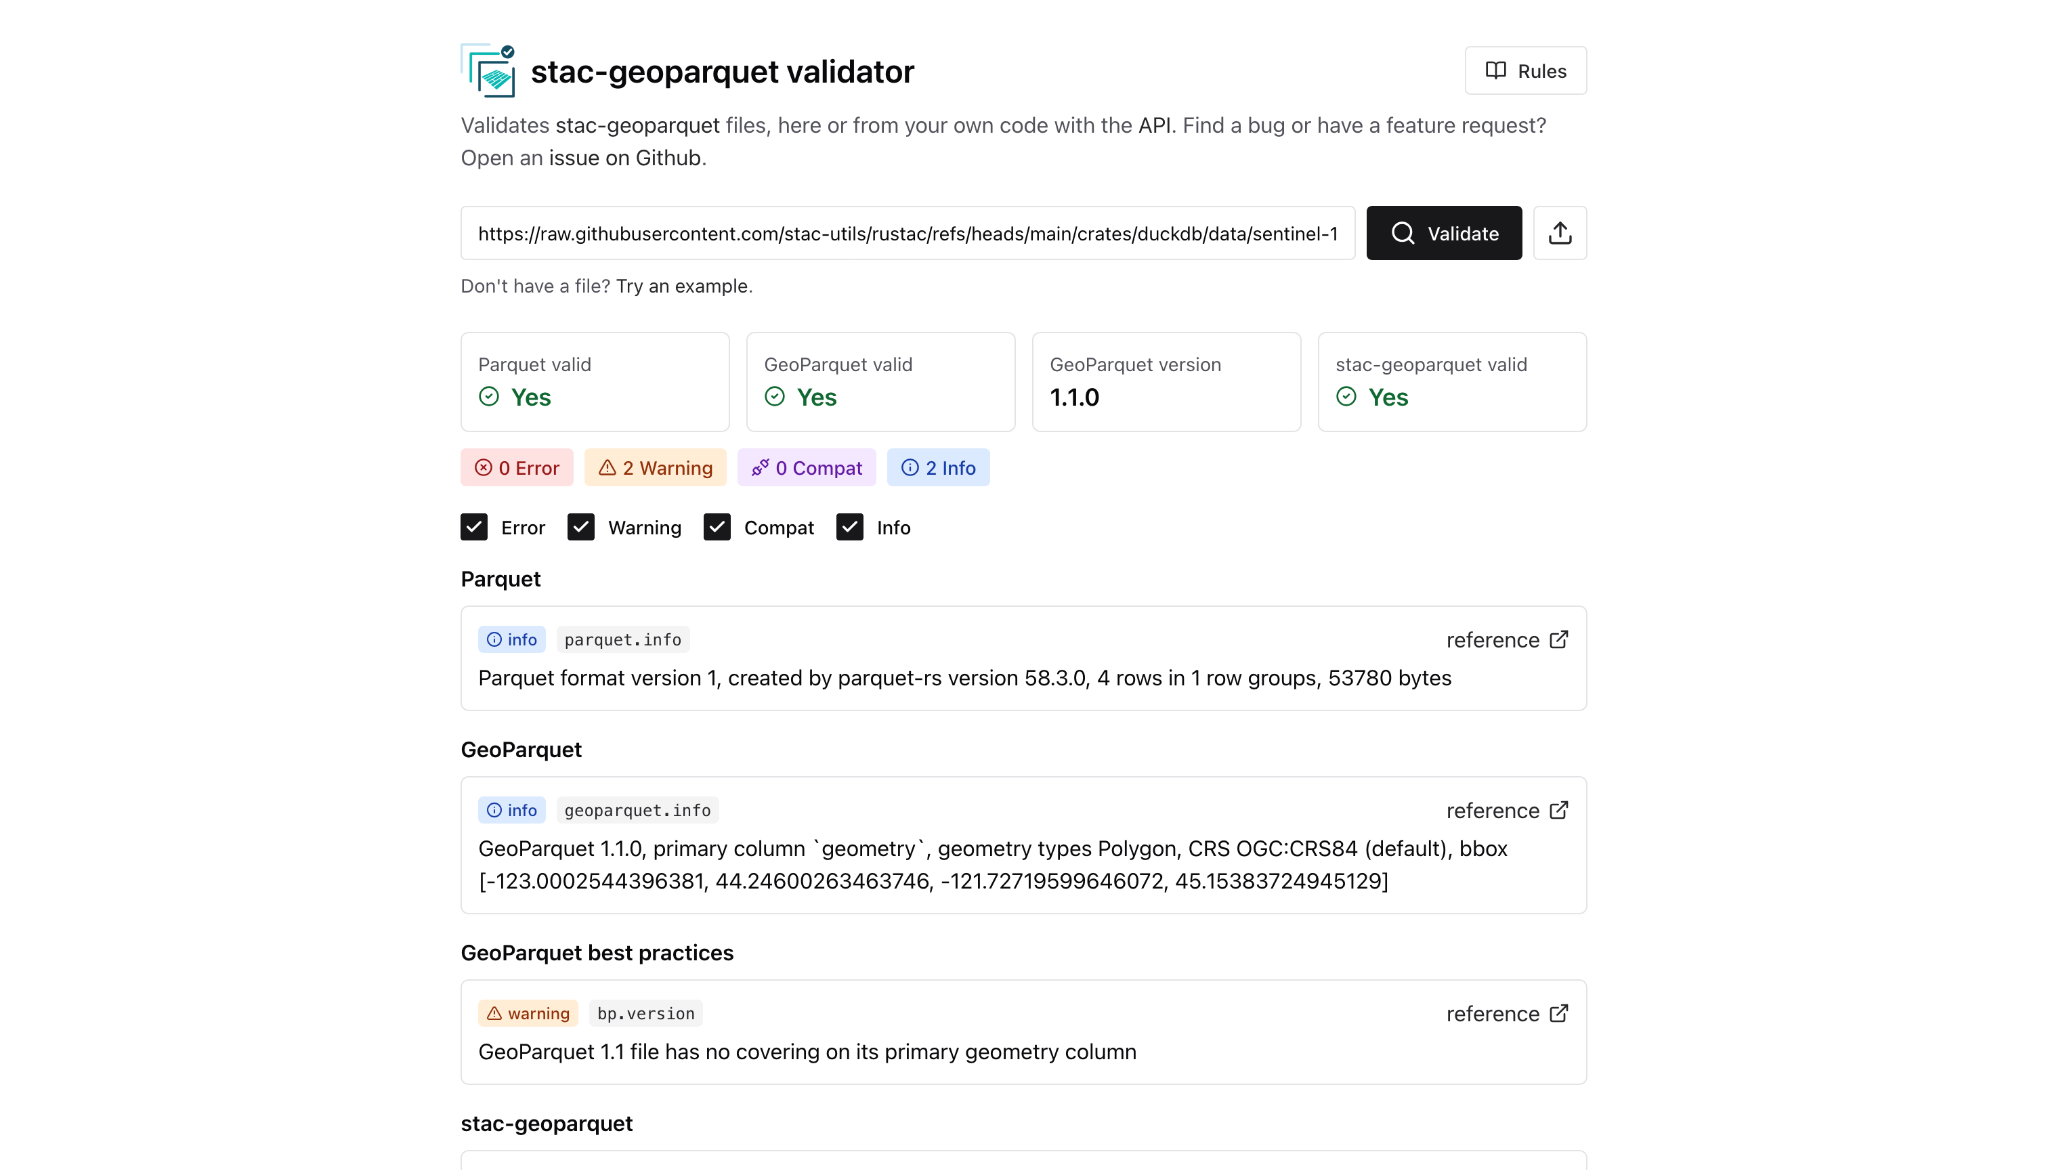
Paste a URL or upload a file, and the validator reports errors, warnings, and info against the specs and best practices, with each check linked to its source.
Making eoAPI Easier to Run in Production
Over the past few months, the eoAPI team has focused on making it easier to run in production. The Kubernetes deployment now includes scheduled database maintenance and built-in metrics, so teams can see how their STAC catalog is performing and keep it healthy without manual upkeep. The AWS CDK deployment also picked up the latest versions of the STAC, raster, and vector services.
On the security side, stac-auth-proxy, which controls who can see which data, shipped fixes for three security advisories, and an upcoming change makes filtered requests dramatically faster (roughly 85 to 4,500 requests per second in early measurements).
For anyone who wants to learn it hands-on, the eoAPI workshop now includes the FOSS4G 2026 material, including a chapter on editing data with authentication.

stac-auth-proxy, deciding who gets to see your data.
Join the Fun
From experimenting with new interfaces to strengthening the open-source tools that support production workflows, these projects reflect the different ways we explore ideas and put what we learn into practice.
We'll keep sharing what works, what we're learning, and where these experiments lead. Follow along on our blog, email list, and GitHub.
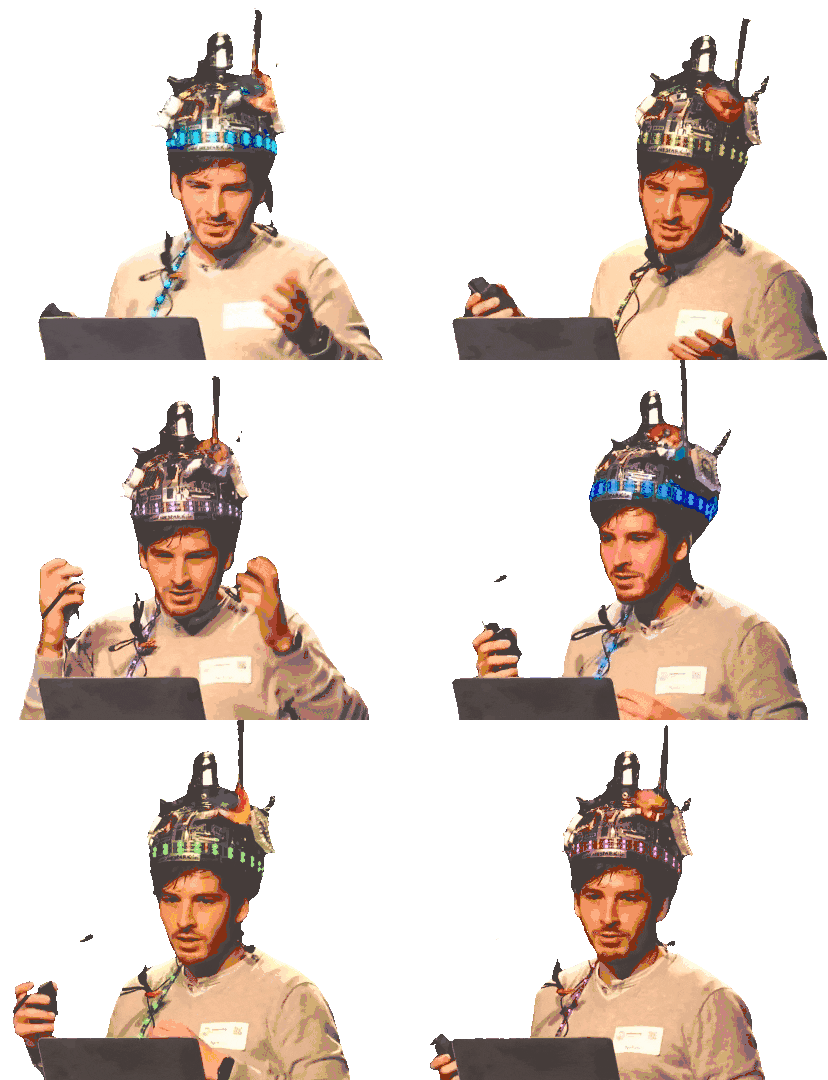
We're thrilled to share our ideas with you!
Related content
More for you
What we're doing.
Latest