


For many fish species, understanding movement is essential for effective conservation efforts. In the Global Fish Tracking System (GFTS), we worked with Ifremer and Simula Research Laboratory to reconstruct fish movements from biologging data, combine those tracks with climate projections, and make the results accessible through an interactive decision-support tool.

Fish consumption has quadrupled over the past 50 years, while global fisheries are under increasing pressure. Today, nearly 90% of fisheries are fully exploited, overexploited, or depleted, according to UNCTAD.
Fish move between spawning grounds, feeding areas, and migration corridors that can span large distances. But most fisheries policy is still based on where fish are caught, not where they live across their full cycle.
Without knowing where fish habitats and migration corridors are, it is difficult to design marine protected areas or set sustainable quotas. And as ocean conditions shift, historical patterns alone are no longer enough to guide decisions.
For many species, effective conservation depends on understanding movement.
Combining biologging data with climate scenarios
Reliable data about fish populations and movement is difficult to obtain. Fish are hard to observe directly. They are not visible in satellite imagery, GPS does not work underwater, and cameras are limited in what they can capture.
Marine biologists address this by tagging fish with sensors that record depth and water temperature. These measurements can be used to infer where fish have been.
But the process is slow and incomplete. It can take months or years for tagged fish to be recaptured, and only a fraction of tags are recovered. Even then, the data does not include location directly — movement must be inferred from depth and temperature measurements.
This leaves a core question: where were these fish over time?
That question is the starting point for the Global Fish Tracking System (GFTS), a project we've built together with Ifremer and Simula Research Laboratory as part of the European Commission's Destination Earth initiative. In GFTS, we reconstruct historical fish movements from biologging data usig pangeo-fish, combine those tracks with climate projections from the DestinE Digital Twins, and make the results accessible through a decision-support tool.
Reconstructing tracks from data with pangeo-fish
Inferring fish location from depth and temperature is possible, but not straightforward. For each fish, we know the release location, the capture location, and sometimes intermediate locations from acoustic signals. This data is combined with ocean conditions at different depths over time.
A single observation can constrain possible locations. For example, if a sensor records a temperature of 13.5°C at a depth of 35 meters on a given day, that narrows the set of locations that match those conditions. When these constraints are applied across time and combined with ocean data, it becomes possible to estimate the most likely path of the fish.
Ifremer has collected fish biologging data across multiple campaigns between 2010 and 2022, including nearly 1,700 tagged European sea bass and more than 400 recovered tracks. They also developed the reconstruction algorithm, now available as the open-source pangeo-fish package, which was further developed as part of GFTS.
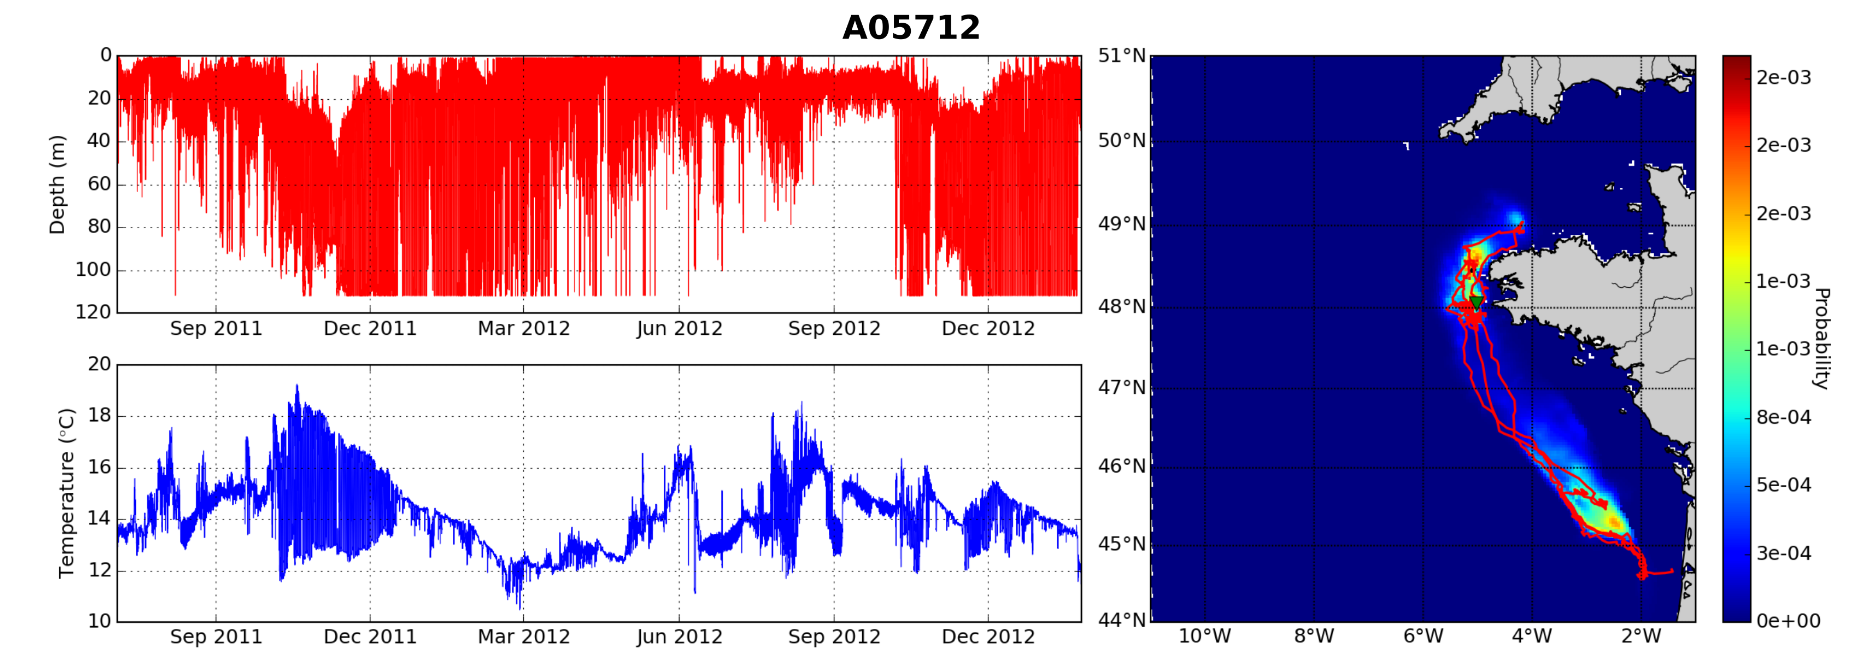
Depth and temperature time series from a tagged fish. These sensor readings are the raw input for track reconstruction. Adapted from de Pontual et al. 2019.
Running analysis at scale
Reconstructing a single fish track can take hours. The algorithms are both compute and memory intensive, which makes it impractical to process hundreds of tracks on a local machine.
Our partners from Simula built a scalable JupyterHub environment based on Pangeo, so researchers can run Ifremer's pangeo-fish software without having to manage the infrastructure themselves.
Now a batch of tracks that would previously run over several weeks now finishes in hours. The resulting outputs are then intersected with DestinE Digital Twin data to assess how current habitats may evolve under future climate conditions.
A decision-support application
The outputs — probability distributions over space and time for each fish — are large and complex. Not something you can just hand to a policy maker. We built a web application as an operational service on the DestinE Platform to make them navigable.
The application supports different types of users. Marine biologists can explore individual fish tracks including the most probable path, daily probability distributions, and associated depth and temperature readings. Policymakers can view aggregated maps that show where populations spend time each season, helping identify spawning grounds, feeding areas, and migration corridors.
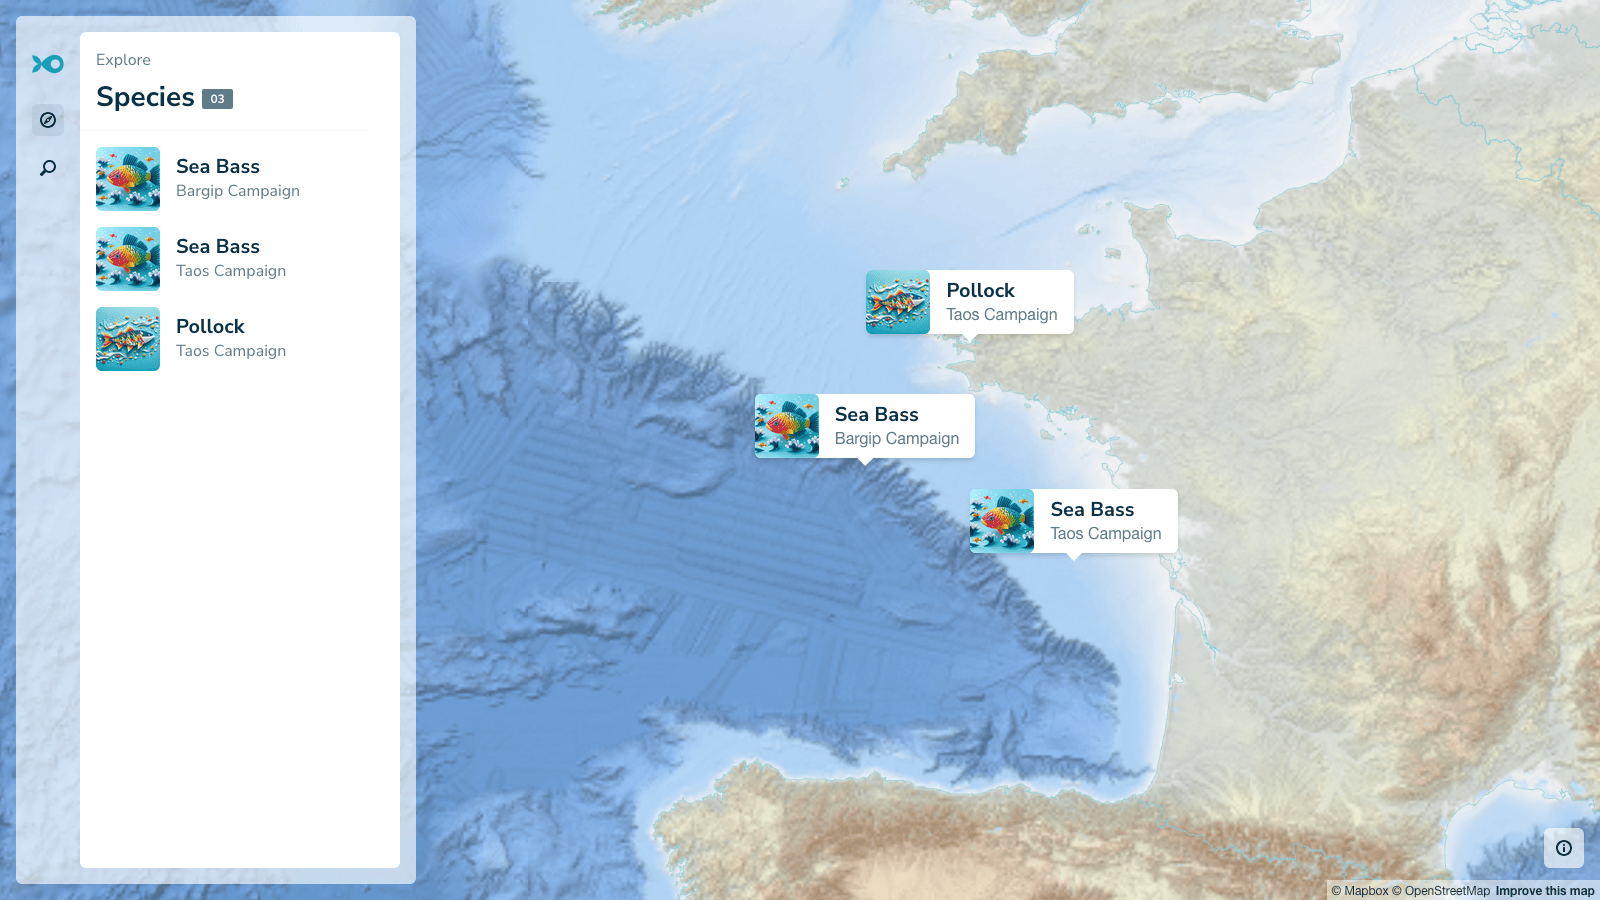
Selecting a species displays seasonal distributions, showing where fish are most likely to be during different times of the year. These patterns have direct biological meaning. For example, the first quarter often corresponds to spawning for sea bass, while the third quarter reflects feeding behavior.
Users can also overlay climate data from the Digital Twin to understand how ocean surface temperature and salinity in these habitats have changed and may change in the future.
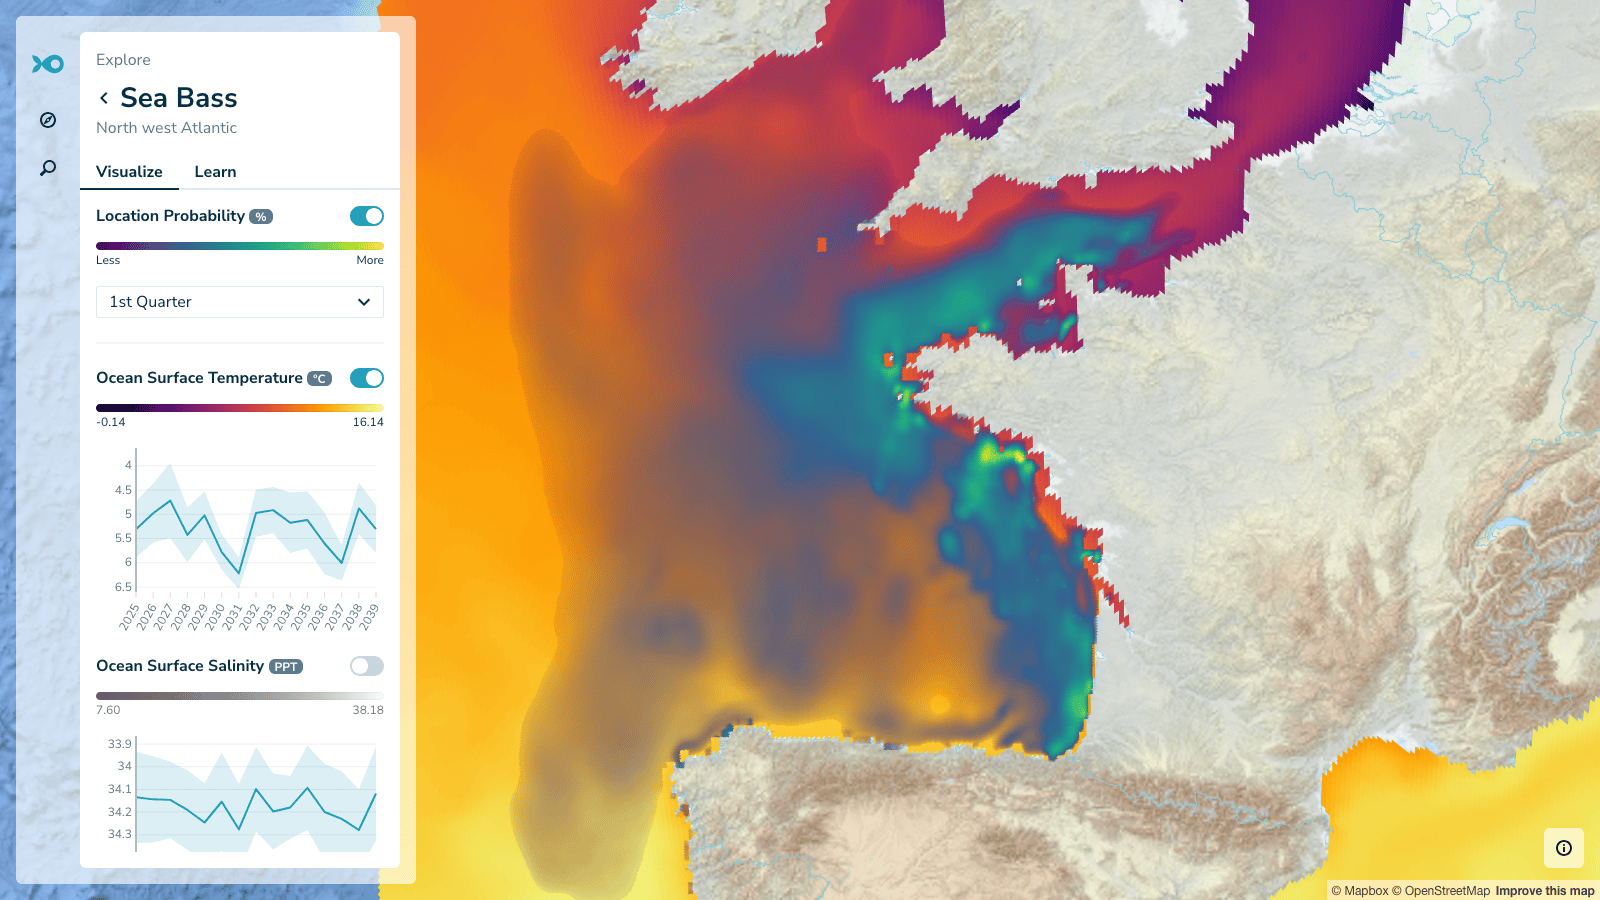
Seasonal habitat distribution for sea bass with Climate Digital Twin temperature overlay. The time-series chart connects historical patterns to climate projections.
Individual fish tracks can also be explored. The most probable route is displayed as a line, with daily probability distributions shown as an animation. Sensor readings are displayed alongside the map, connecting raw data to reconstructed movement.
Before GFTS, spatial detail like this typically didn't leave research papers. Now it's in a browser where it is possible to explore fish movement in space and time through an interactive interface.
Individual fish track with animated daily probability distributions. Sensor readings are displayed alongside the map.
Making HEALPix data work on the web
A key challenge in building GFTS was rendering HEALPix data in the browser. Scientific tools like Python and xarray have support for HEALPix, but web mapping libraries do not.
We worked around this by converting HEALPix cells into geographic polygons. Each cell can be represented as a four-sided polygon, defined by its corner coordinates. We built healpix-ts, an open-source TypeScript library, to handle these transformations. It converts HEALPix cell IDs into geographic coordinates and supports operations such as neighbor lookups and range queries.
The frontend reads HEALPix data directly in the browser, without relying on server-side conversion.
Rendering and animating this data at scale required additional optimization. We used deck.gl, a GPU-accelerated WebGL framework, and developed a custom HEALPix layer. The layer offloads computation to web workers and renders via GPU textures, which is what makes animating hundreds of thousands of cells practical.
This work is available as the open-source deck.gl-healpix library and allows you to smoothly render and animate hundreds of thousands of cells.
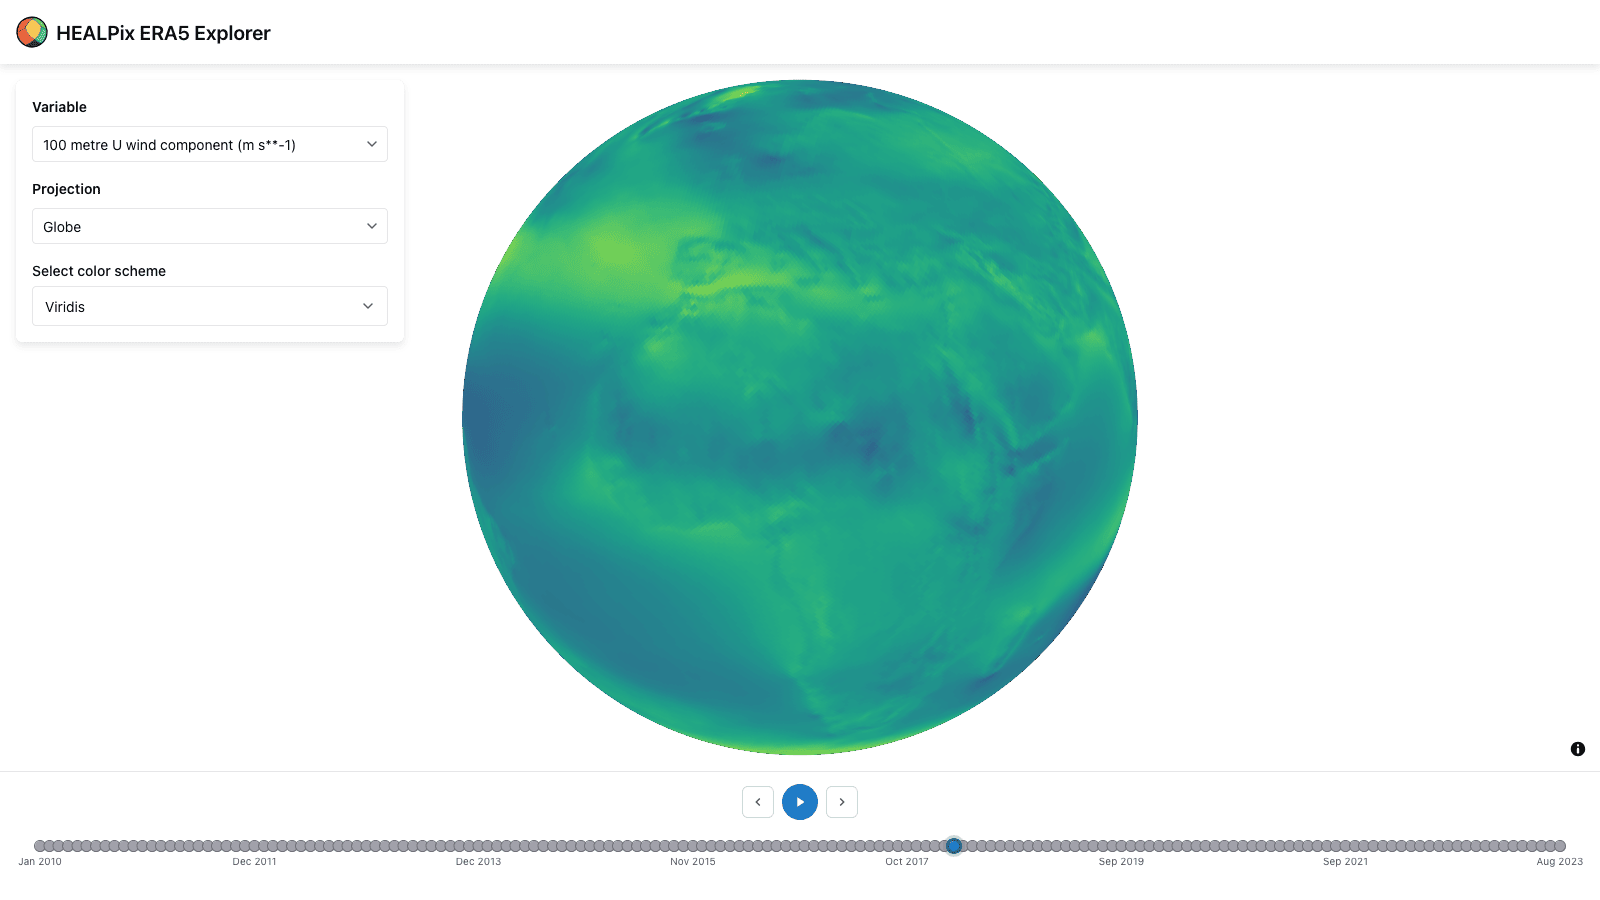
HEALPix data explorer app: A tool to explore HEALPix ERA5 data in the browser, demonstrating the capabilities of the healpix-ts and deck.gl-healpix libraries.
Get involved
GFTS helps answer long-standing questions in marine science like where do sea bass spawn, and how stable are those locations over time? Which routes do fish take between their feeding and spawning habitats? Are those routes affected by human activity? How will habitats change as ocean temperatures rise?
This approach is generalizable. The pipeline we developed — biologging data, geolocation model, scalable computing, and an interactive interface — can be applied to other species and regions where similar data is available.
GFTS is an open-source project. The code, documentation, and data pipelines are publicly available:
- pangeo-fish (geolocation modeling): github.com/pangeo-fish/pangeo-fish
- GFTS processing and JupyterHub: github.com/destination-earth/DestinE_ESA_GFTS
- Decision-support tool: github.com/developmentseed/gfts
- Project documentation: destination-earth.github.io/DestinE_ESA_GFTS
- Live tool: platform.destine.eu/services/service/global-fish-tracking-service
GFTS is a Destination Earth Platform Use Case funded by the European Union and implemented by ECMWF, ESA, and EUMETSAT, with partners Ifremer, Simula Research Laboratory, and Development Seed.
What we're doing.
Latest