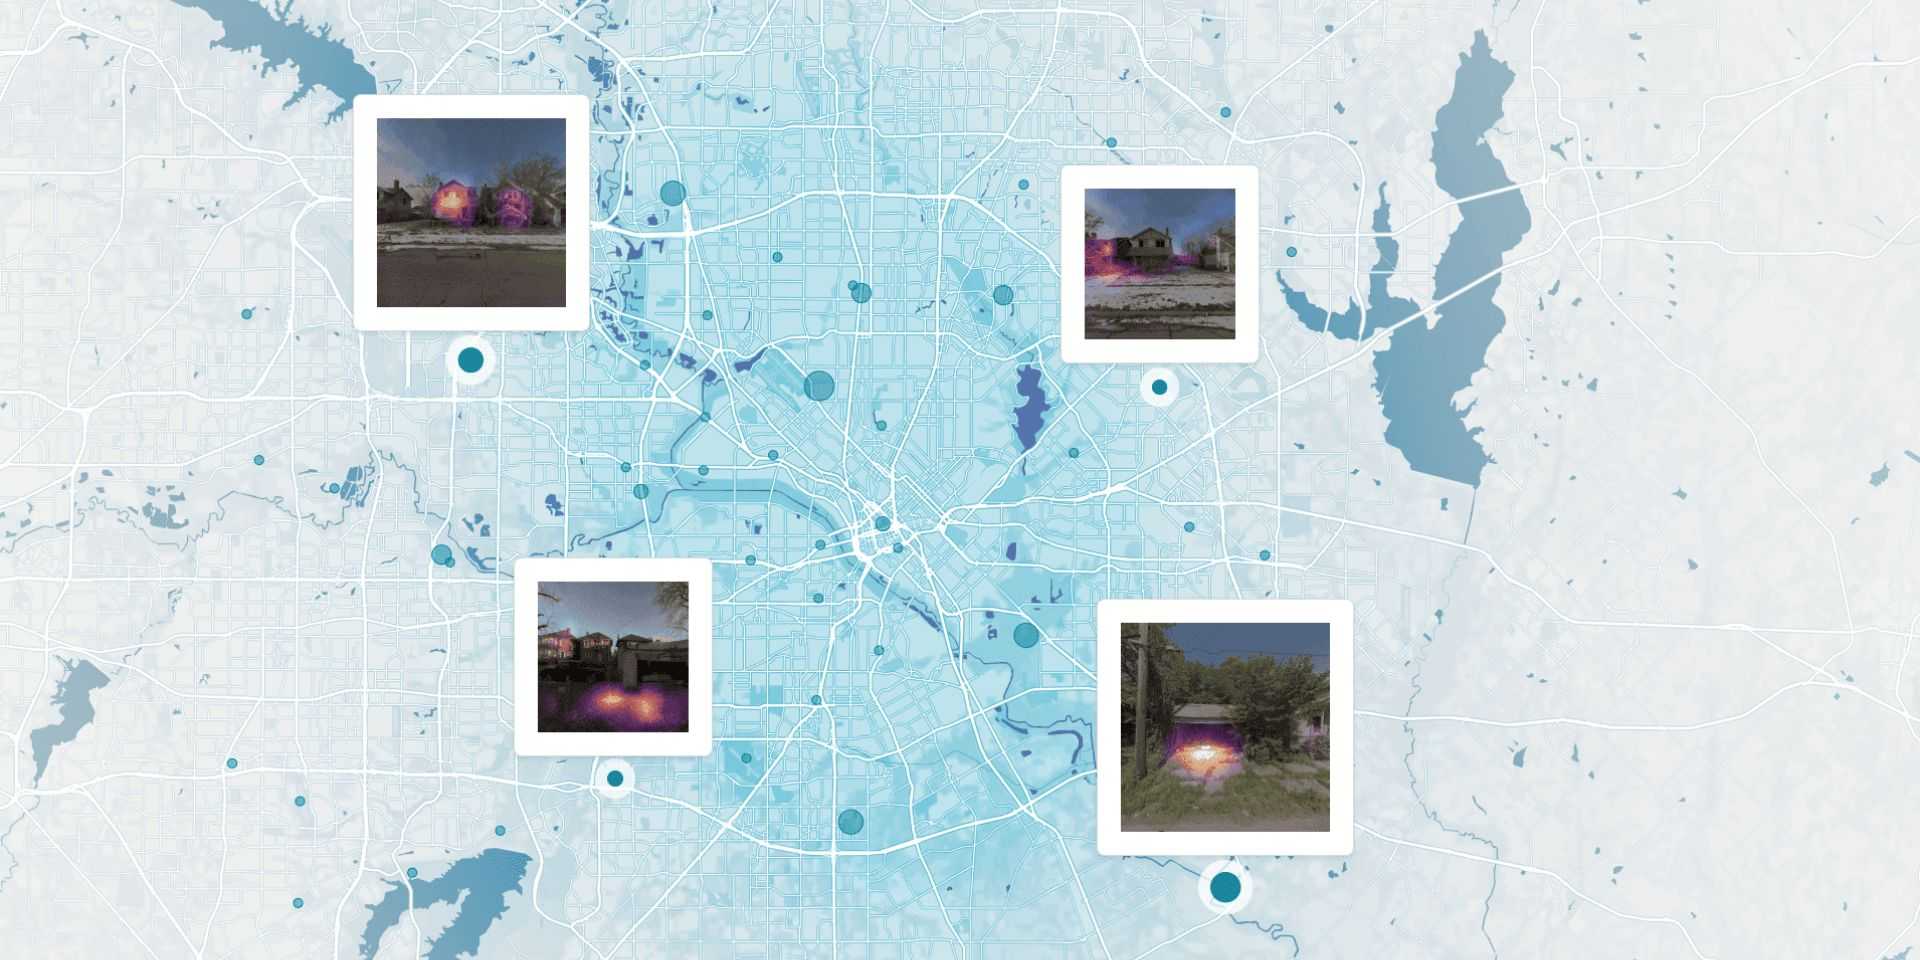
Machine learning can help city planners predict urban blight - a strongly correlated indicator of violence.

After a spike in violent crime in 2019 with over 200 murders, the Dallas mayor declared a city emergency, promising to dedicate resources to public safety solutions. With the help of the Dallas-based Child Poverty Action Lab, a mayoral task force highlighted blight remediation as a proven and effective way to reduce violent crime. However, the city needed better and more timely data on where blight exists to become more proactive about addressing problems in underserved communities with the highest risk of violence.
Data on blight, however, is most often captured from administrative data showing where resources were used to address reported blight conditions. This past-looking and self-reported approach makes it difficult to understand trends or concentrations of blight or where new ones may be developing. Without a full picture of the true blight conditions in a community, cities are unable to allocate resources for mitigation appropriately.
Our team built the Urban Blight Tracker to help the Child Poverty Action Lab (CPAL) and other community-based organizations and city agencies in Dallas pinpoint and identify blighted areas, enabling targeted interventions. Using street view data, we collaborated with CPAL to develop training data and model labels for urban blight detection, build and validate a machine learning model, and visualize the results via a novel web interface. This tool is designed as a leading - rather than lagging - indicator for violent crime, empowering service providers to rapidly address residents’ needs.
Detecting Blight Via Street View Imagery
While direct observation is a key method of validation, using street view imagery for urban blight detection vastly enhances public agencies’ awareness of and responsiveness to neighborhood-level conditions and issues. CPAL came to us to better understand and visualize where blight exists, how to measure it, and how to harness the power of AI and machine learning to automate and improve detection. Our past work building the World Bank’s Housing Passports application set the stage for us to quickly understand the problem, develop models and visualize results on the web.
Identifying urban blight is a complex challenge, requiring the expertise of domain experts and the participation of local communities. This process is labor-intensive, introduces human bias, and is often limited in scope and scale. Data on blight typically reflects where it has been reported rather than where it reflects the most urgent community needs.
In partnership with CPAL and Kaart, we built a deep-learning computer vision model for multi-label multi-classification of street view imagery. Indicators of blight, such as broken and boarded-up windows and vacant lots, are classified, and a severity level is predicted. More than 180,000 street view images were first captured in May 2022 during the data collection campaign, over 7,500 of which were annotated by our Data Team (GeoCompas) as having one or more elements of urban blight. We used Mapillary to upload and process images, relying on their computer vision models to blur faces and reduce exposure of sensitive information like license plates.
Building High-Confidence Models
The change in urban blight in Detroit has been well documented, and this served as a case study for training computer vision models on street view imagery. In preparation for the imaging campaign in Dallas, our team first annotated 6,000 images across seven neighborhoods in Detroit from Mapillary street view data. We generated an annotated dataset (read more from GeoCompas) and prototyped our model to validate our understanding of urban blight detection.

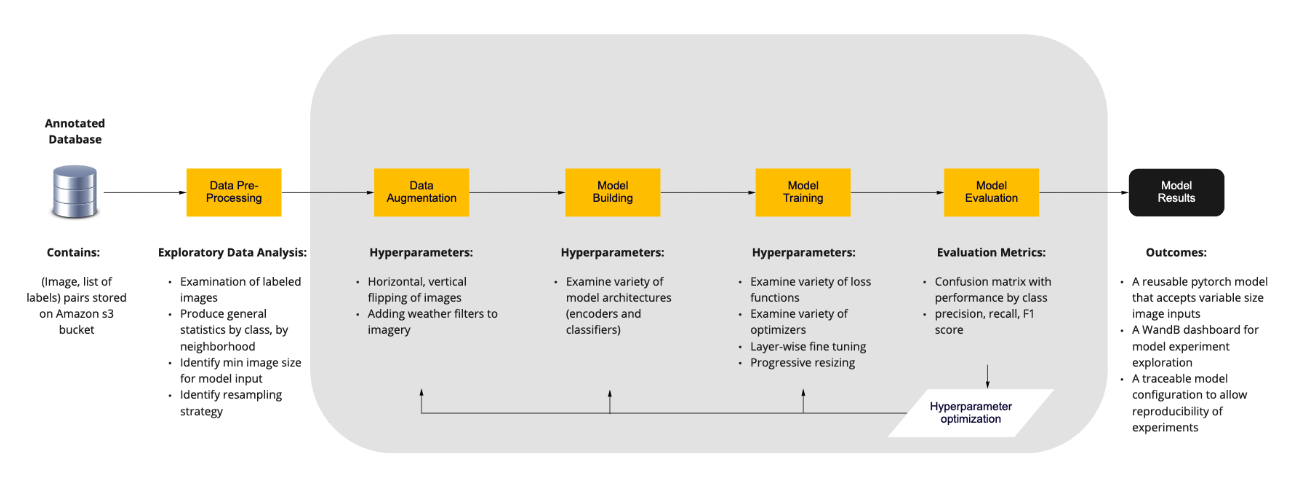
Fig. 1: A conceptual diagram of the machine learning workflow utilized in this project.
We then determined which conditions of urban blight are most visible in street view imagery and documented which distinctive features could help improve model confidence. Two key challenges were a high class imbalance across the training data and correspondingly low data availability for certain classes. Classes such as overgrown lawns and litter were more predominant in the images captured within the city, while damaged roofs and structural issues were less present. We implemented many data augmentation approaches, including MixUp, to further train the model to overcome these challenges.

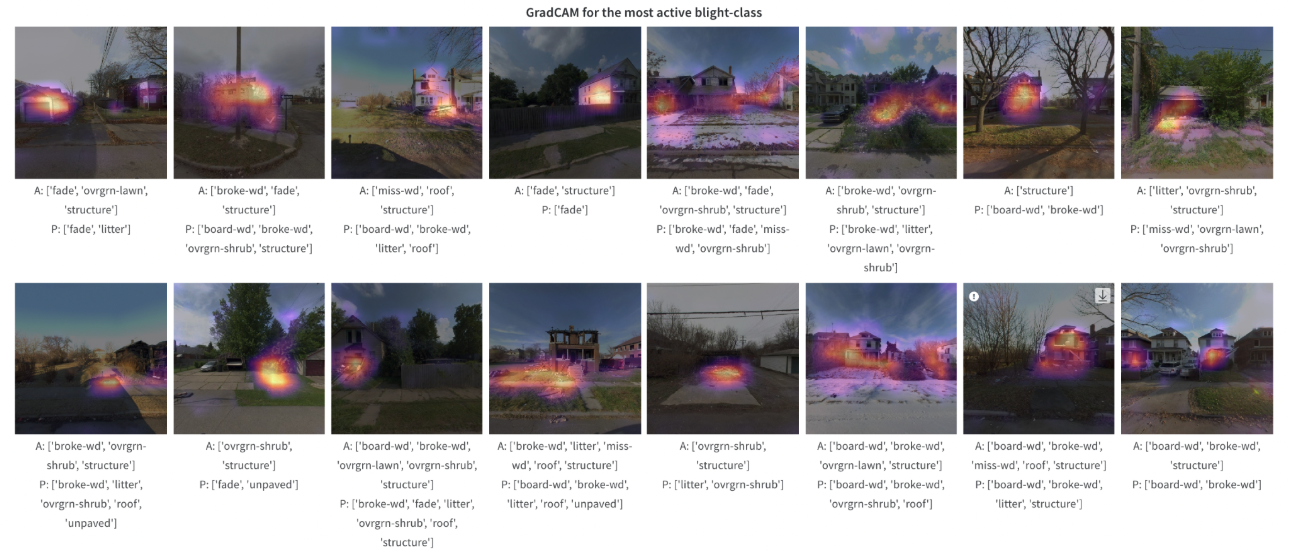
Fig. 2: Heat maps of Class Activation Maps (CAM) to understand where the model gives more attention in an image
The model was trained to produce high-confidence estimates for visual signs of urban blight by classifying distinctive features with sufficient examples across Dallas' urban landscape. A confidence score threshold of 0.5 was used to assign the presence of predictions to each class. A total of 16 blight classes (e.g., overgrown lawns, structural issues, litter, etc.) were further divided into two categories, vacant lots and structural issues, for ease of interpretation and mapping. We relied on Hydra and Weights and Biases to configure and manage the models and further refined the model via extensive testing and tracking in confusion matrices. Read more about the image annotation process, model development, and methodology here.
User Interface and Tool Features
The Urban Blight Tracker is an interactive map-based interface for querying, analyzing, and understanding the impact of blight in the Dallas area. Users can visualize and explore the spatial distribution and concentration of predicted urban blight in Dallas, providing evidence for further action in blight remediation.
Our team conducted user research to better understand how the tool could be used to enhance community organizations’ efforts. Through this process, we recognized that the visualization and exploration tool would need to allow users to:
- Communicate the severity of the impact and need of blight with external stakeholders
- Help identify the right point of service (e.g., community-based organizations for local clean-ups, city agencies for large-scale trash removal)
- Share information with key partners, whether they’re a city agency or community-organization. For example, a local lawn mowing effort may be routed to an organization like Pop-Up Comfort, while large-scale trash may be routed to the Department of Sanitation
- Advocate for the right amount or type of funding
- Target priority communities for improvements
Fig. 3: The explorer in action at the city level, the block, and the parcel unit level
The application permits navigation from the city level down to the parcel level, with aggregation at census block or tract levels in between. Users can explore the results of the machine learning model in aggregate or can view the attributes of individual parcels. After analyzing the massive trove of street view images captured for the initial Dallas blight tracker, we also generated a normalized Blight Index to more accurately depict where blight was more severe rather than simply more populated or more densely imaged.
The data output by the machine learning model will inform key stakeholders about where blight conditions can be found, how severe they are, and how much remediation may cost. Critically, local partners can search within specific geographic ranges - or for specific problems - that they’re most equipped to remediate.
Future Directions
For CPAL and the City of Dallas, identifying where blight exists and its severity will help establish where and what steps to take next. Future processing and analysis of periodic street view imagery will help CPAL and partners measure the change in blight remediation over time.
Thanks to the ubiquity of street view imagery and the increasing ability of machine learning to make high-confidence predictions, it’s easier than ever to provide the data that communities need to survey and analyze the built environment. If you are interested in how this method of leveraging street view imagery and machine learning might help your project, or you’d like to learn more, reach out to us; we’d love to hear about your challenges.
What we're doing.
Latest
