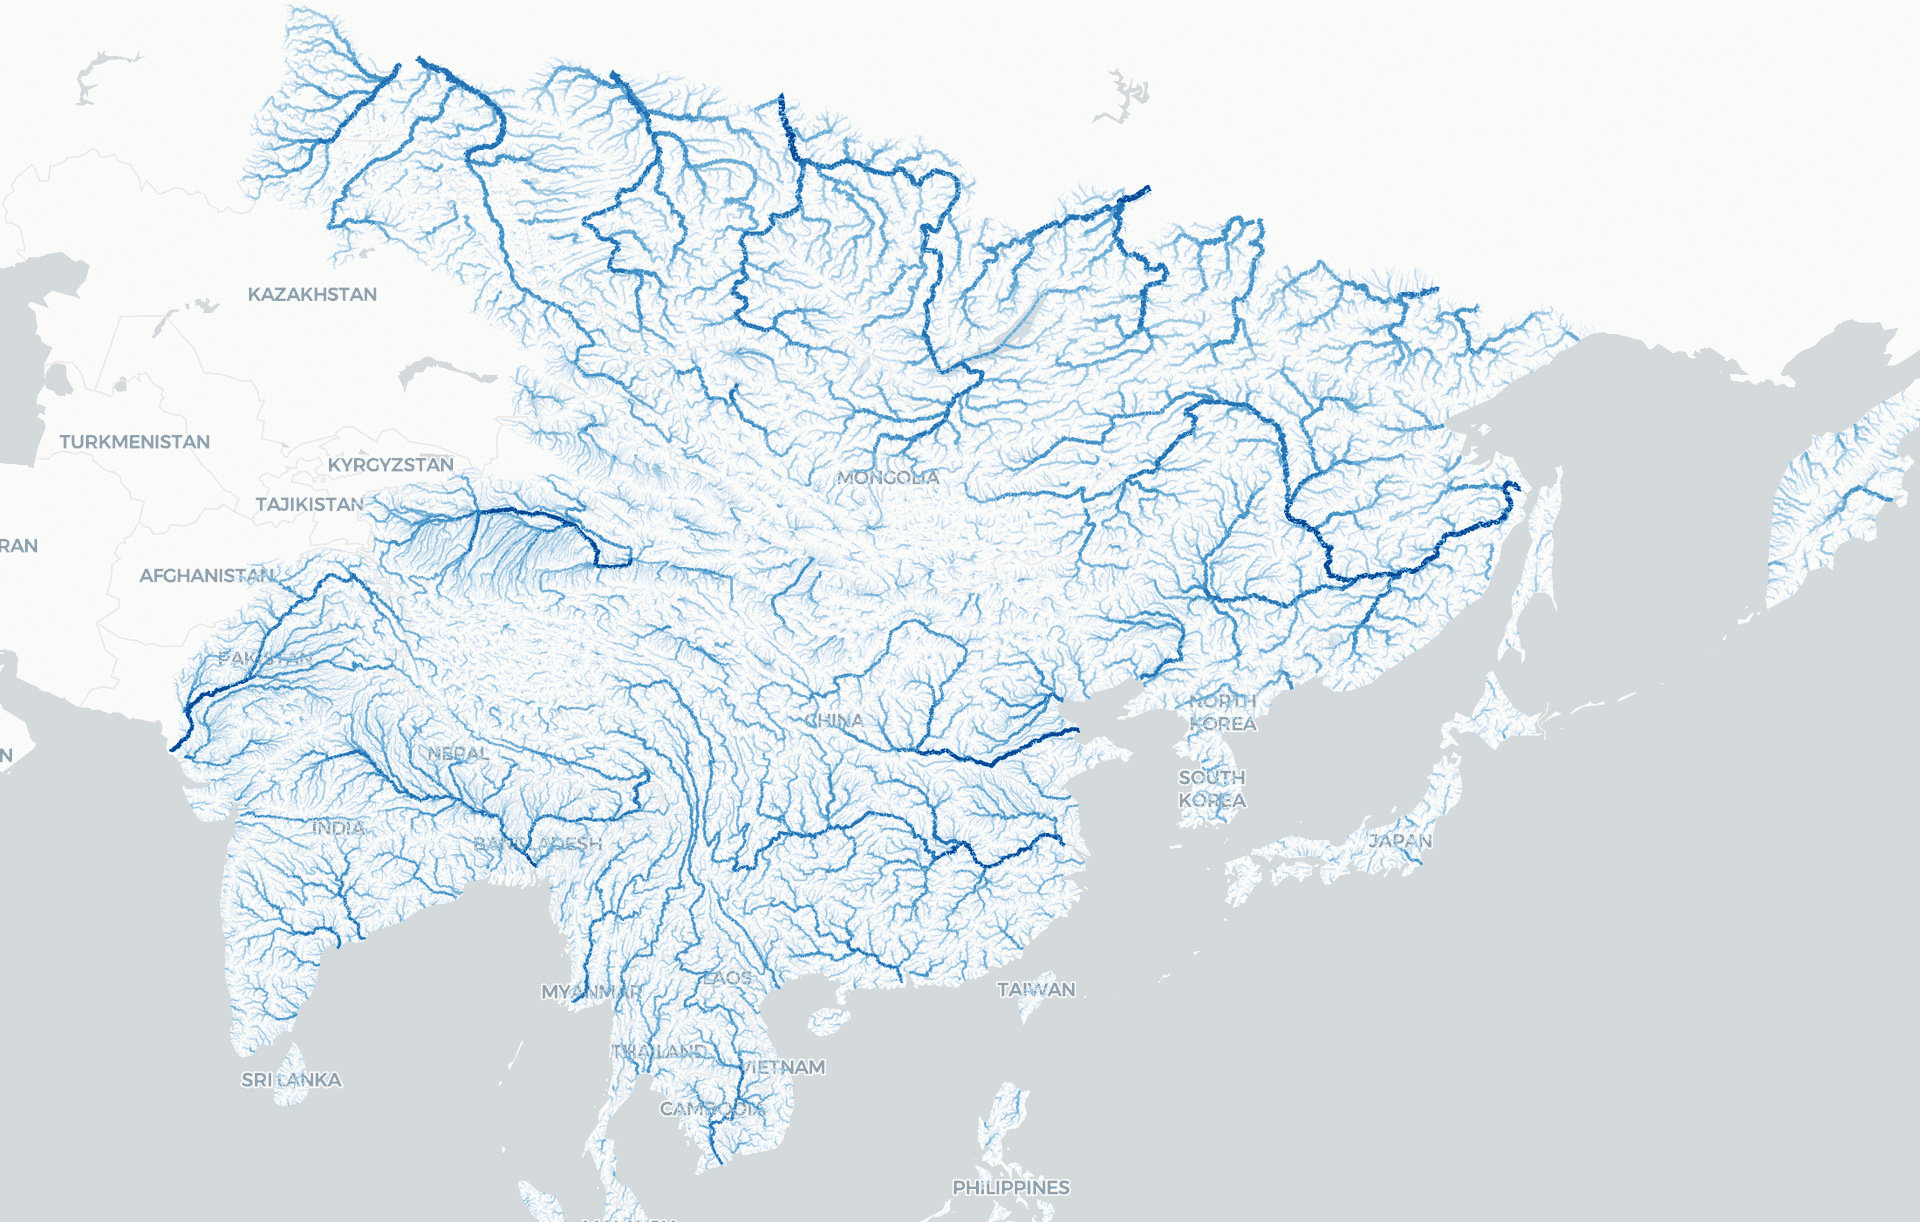
Lonboard can visualize data faster than previous approaches.
Recently, we launched Lonboard, a Python library for visualizing large geospatial vector data in Jupyter. Lonboard addresses key challenges in data exploration and the bridge between data science in Python and publication in Javascript.
Cloud-native data publishing, processing, and analysis strategies are crucial for managing the increasing volume of geospatial data and enhancing collaborative, repeatable workflows. Utilizing advanced technologies such as GeoArrow and GeoParquet, Lonboard significantly speeds up data visualization far surpassing previous capabilities. These technologies allow Lonboard to completely avoid text serialization between the Python environment and Javascript and the GPU for visualization. The data remains in an efficient binary format through the entire pipeline without any downscaling or aggregation.
Lonboard significantly speeds up data visualization far exceeding previous capabilities.
Lonboard is significantly faster than previous Python data visualization libraries such as pydeck, ipyleaflet, and folium, not merely in terms of speed — where it excels by a wide margin of 10 to 50 times — but also in robustness. Lonboard effortlessly handles datasets with millions of data points, enabling visualizations that weren’t possible before. We are encouraged by the geospatial and data science communities' response so far. If you're using Lonboard, open an issue to feature your work on our new examples page.
Lonboard is one of our efforts to drive the adoption of cloud-native, analysis-ready formats and infrastructure for geospatial applications, integrating these advancements into platforms like Jupyter to boost data science applications.
A vision for vector data efficiency
Lonboard is fast because of GeoArrow, a new binary format for geospatial data. To simplify the user experience with existing libraries, such as GeoPandas and Shapely, Lonboard transparently converts the user's input data into GeoArrow, which is then passed to the browser for rendering. Lonboard is even faster when used with the burgeoning GeoArrow ecosystem, including geoarrow-rust, geoarrow-pyarrow, and pyogrio (GDAL), because no extra conversions are necessary. Our vision is to bring all vector geospatial operations entirely into GeoArrow, which will allow us to share data between tools like GDAL and Lonboard’s Python API at zero cost — no more conversion or serialization.
This is a major shift in vector geospatial data management. Starting with GDAL 3.6, GDAL can export GeoArrow directly. This is both faster than reading into a GeoPandas data frame and additionally removes the need for subsequent conversions to GeoArrow for working with Lonboard.
Lonboard integrates with the geoarrow.rust library, which implements the GeoArrow specification, and connects to GeoRust algorithms for efficient spatial operations. We recently shipped geoarrow-rs v0.2, which can read and write native geospatial formats like FlatGeobuf and GeoParquet, and has initial support for reading from PostGIS.
Early adopters
The data science community has been actively trying Lonboard and putting it through its paces. It’s great to see how versatile Lonboard integration is into existing analysis frameworks like Panel and Fused as well as Jupyter notebook publishing tools like notebooksharing.space. Jaan Li created a visualization of the American Community Survey, a dataset with millions of points, to examine income distribution across the country. We’re also collaborating with the Overture Maps Foundation to build tooling to explore their vast collection of geospatial data.
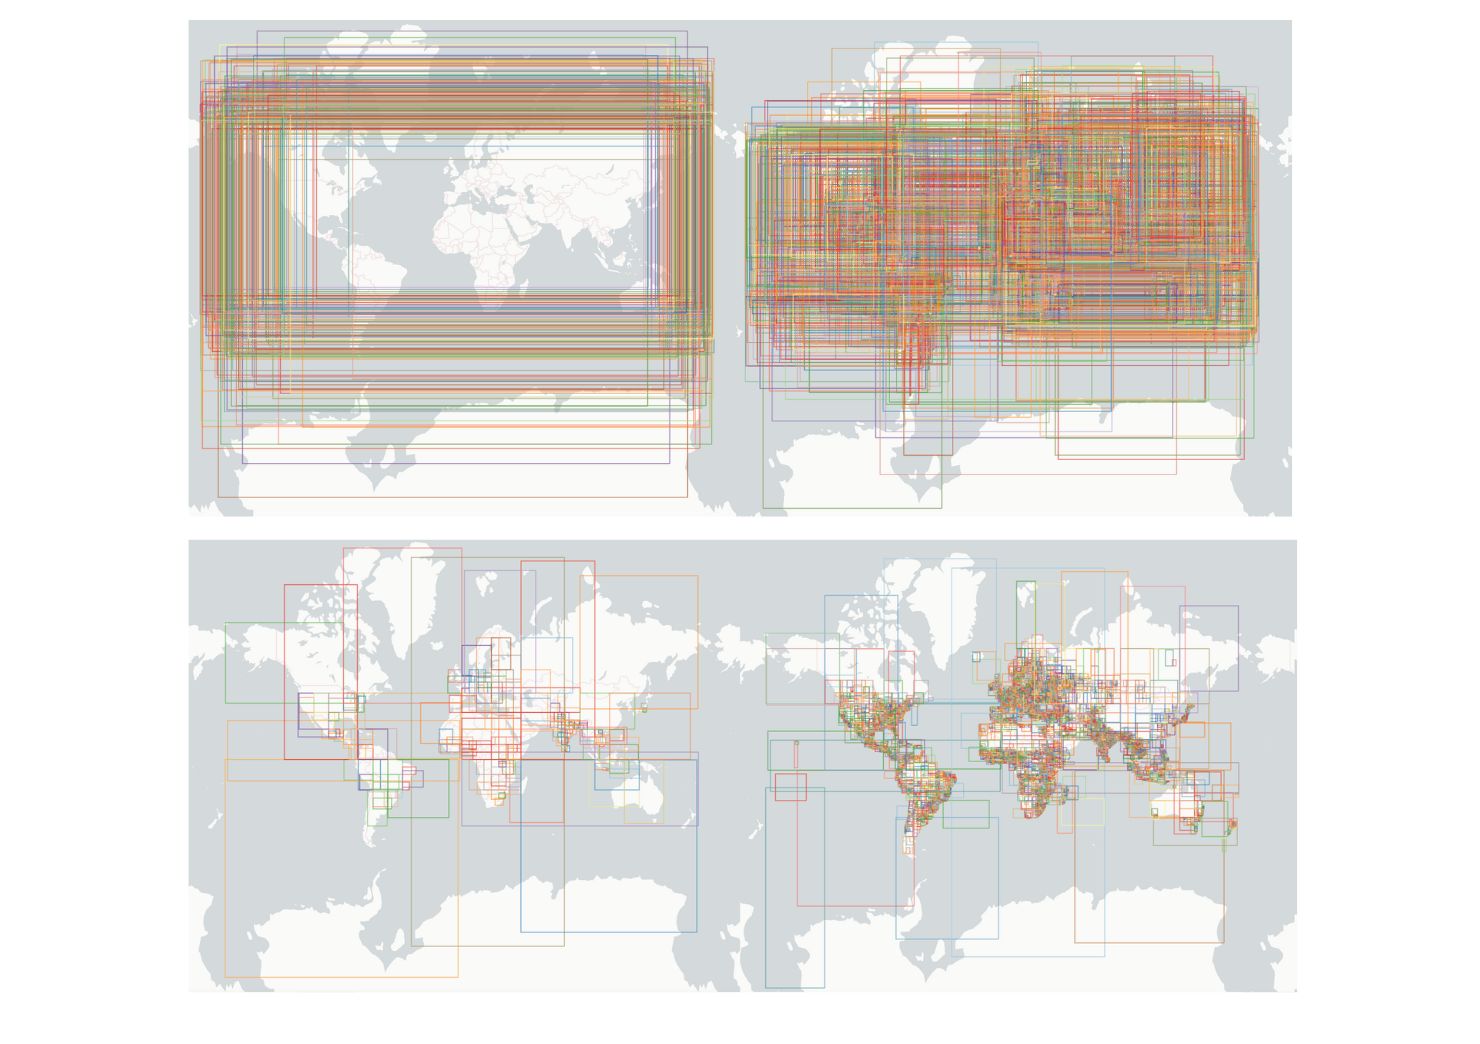
Figure 1: Visualizing Overture building data extent with Lonboard. Top: January release. Bottom: March release, highlighting improvements in the data structure. Credit: Jake Wasserman @jwass
New features in Lonboard
Lonboard has received significant updates since the launch, with version 0.7 released last week.
New layer types, filters, and interactivity
Lonboard’s visualizations are powered by the deck.gl JavaScript visualization library, which supports many layer types for visualization. Lonboard now supports the PointCloud, Heatmap, and Arc layer types, in addition to many core layers like Scatterplot, Path, and Polygon, which were already supported. We’re making progress on exposing more of those layer types to Python, even though Lonboard may not support the entire deck.gl API.
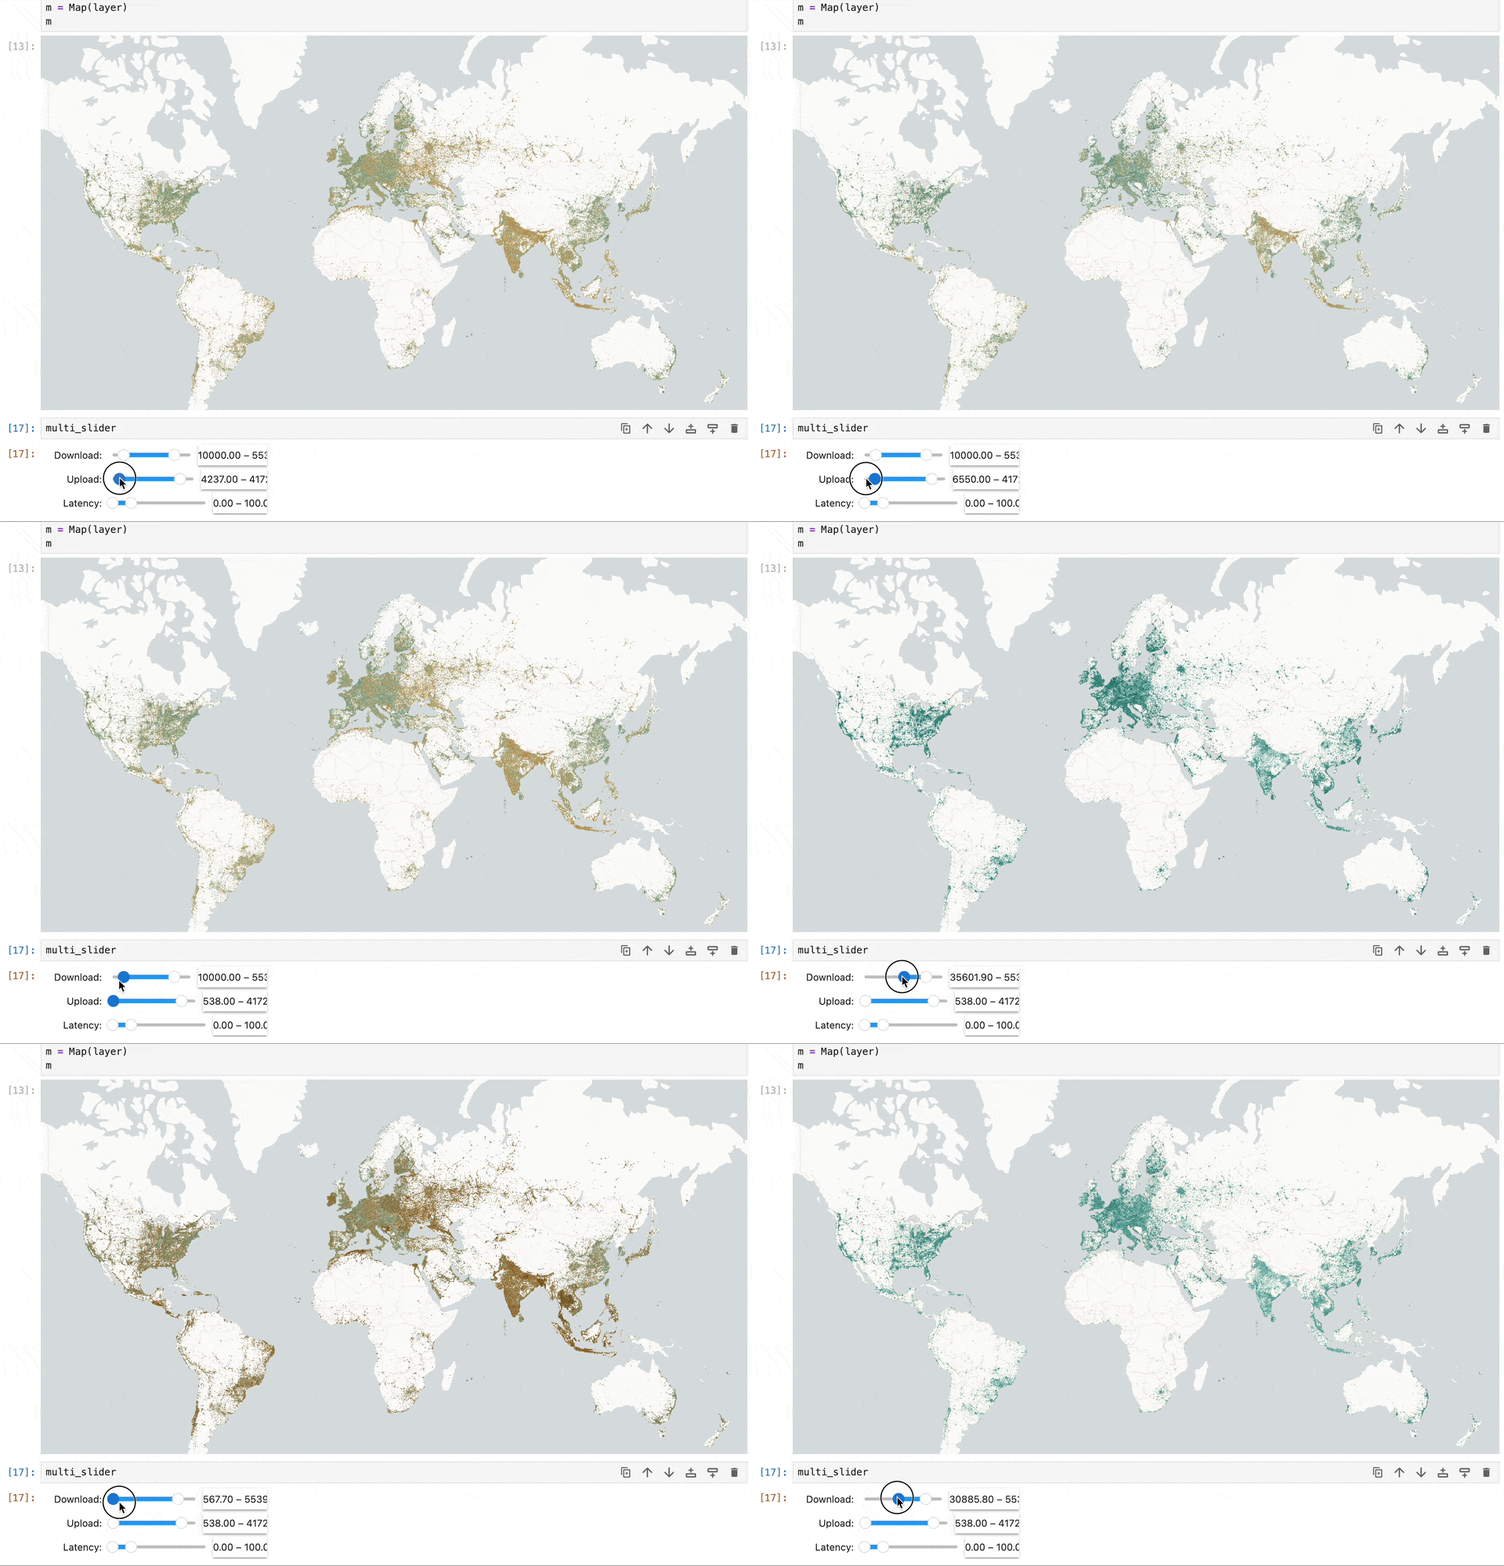
The DataFilterExtension adds GPU-based data filtering functionalities to show or hide objects based on user-defined properties. The GPU acceleration enables filtering at 60 frames per second, even from Python. Lonboard now also supports brushing and collision filter extensions.
Figure 2: DataFilterExtension functionality. Filtering Speedtest data based on various attributes.
Now, you can click the map to get the data index back in Python. This means that on the Python side, you can access the GeoDataFrame row that you clicked on (using gdf.iloc[layer.selected_index]). In the future, we’ll have bounding box selection so that you can select a range of data. This is useful for selecting multiple features on the map.
Command line utility
We added a command line utility to Lonboard for generating quick visualizations. This is useful to preview large datasets or create static HTML files. Even though Lonboard is primarily used for exploratory data visualization within Jupyter notebooks, there’s a need to share just the interactive visualization in an HTML file with others outside the Jupyter ecosystem. We also added the ability to export Lonboard maps from Python as a static HTML file, allowing anyone to share the maps widely by sharing the HTML file or simply hosting it.
What’s next
We are now actively working with groups like OpenAQ, Overture, and NASA IMPACT to integrate Lonboard into their data science and visualization workflows. This is helping us to learn more about how Lonboard can serve the data science communities and prioritize the development roadmap. If you are interested in learning how to use Lonboard, check out the documentation and examples here. If you’d like to find out how Lonboard can help your workflows, please reach out to us.
Follow @kylebarron2 or catch him at GeoPython 2024 in May talking Lonboard.
What we're doing.
Latest


