Another example of large scale mosaicJSON
Earlier this week in COG Talk 4 we shared how to do large scale processing using Cloud Optimized GeoTIFF and mosaicJSON. Here is another example of how to create simple visualization tools when you store the data as Cloud Optimized GeoTIFF.
Montreal LIDAR dataset
Ref: http://donnees.ville.montreal.qc.ca/dataset/lidar-aerien-2015
Format: .LAZ (Point Cloud)
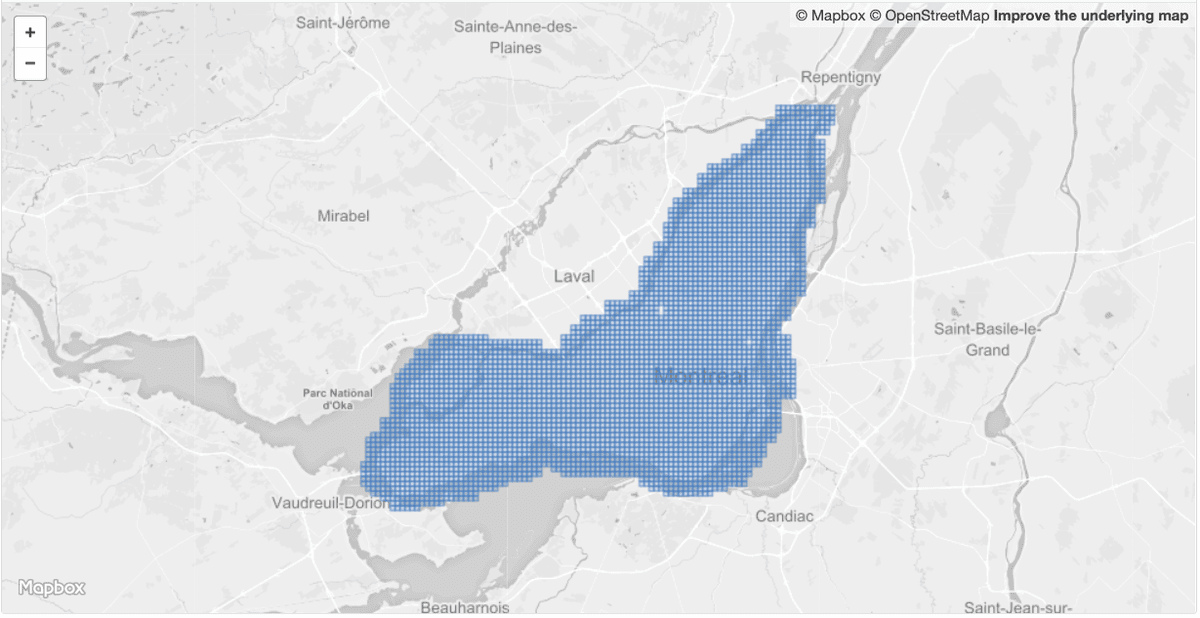
 Coverage of the Montreal opendata LIDAR dataset.
The dataset is formed of 684 different COG created from .LAZ file using a modified version of our cogeo-watchbot-light stack. Each COG has a 25cm pixel resolution and two bands (Min and Max, see PDAL docs).
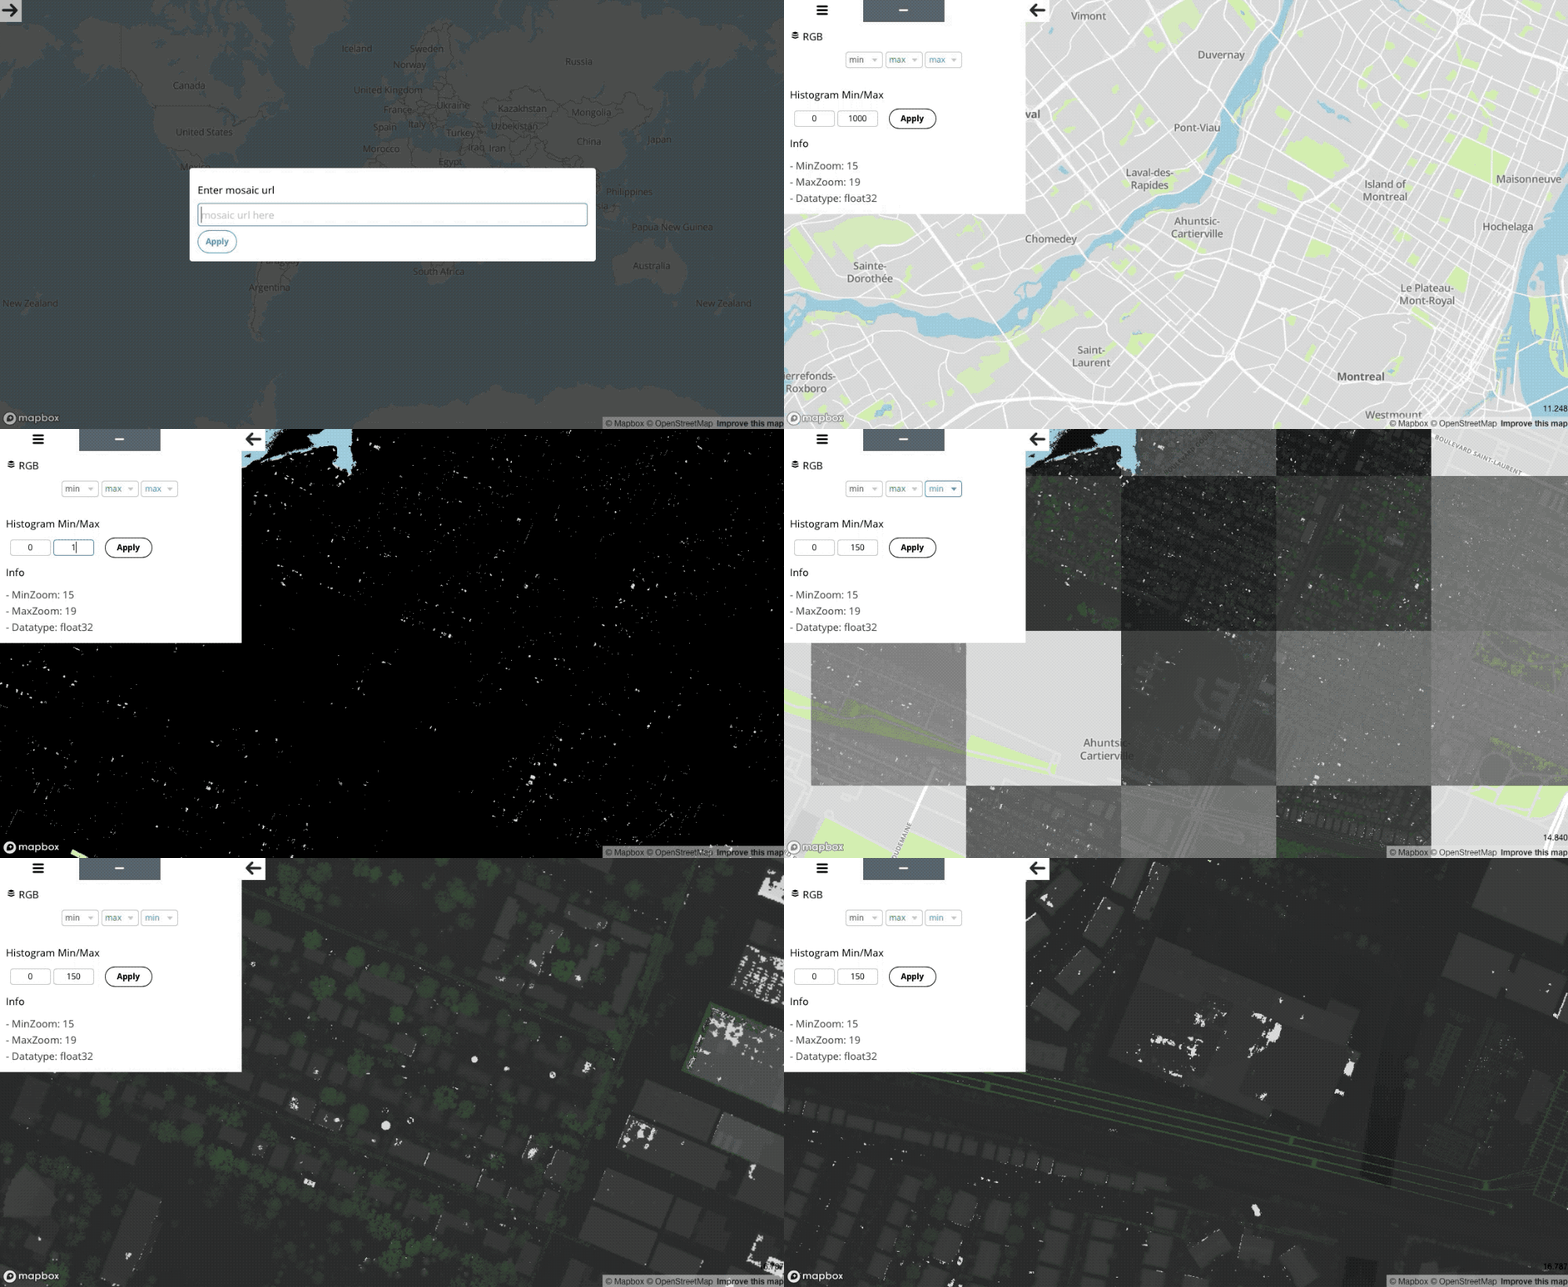
See it live: https://cogeo.xyz/projects/MTLidar/index.html
 We can visualize the mosaicJSON using cogeo-mosaic-tiler stack.
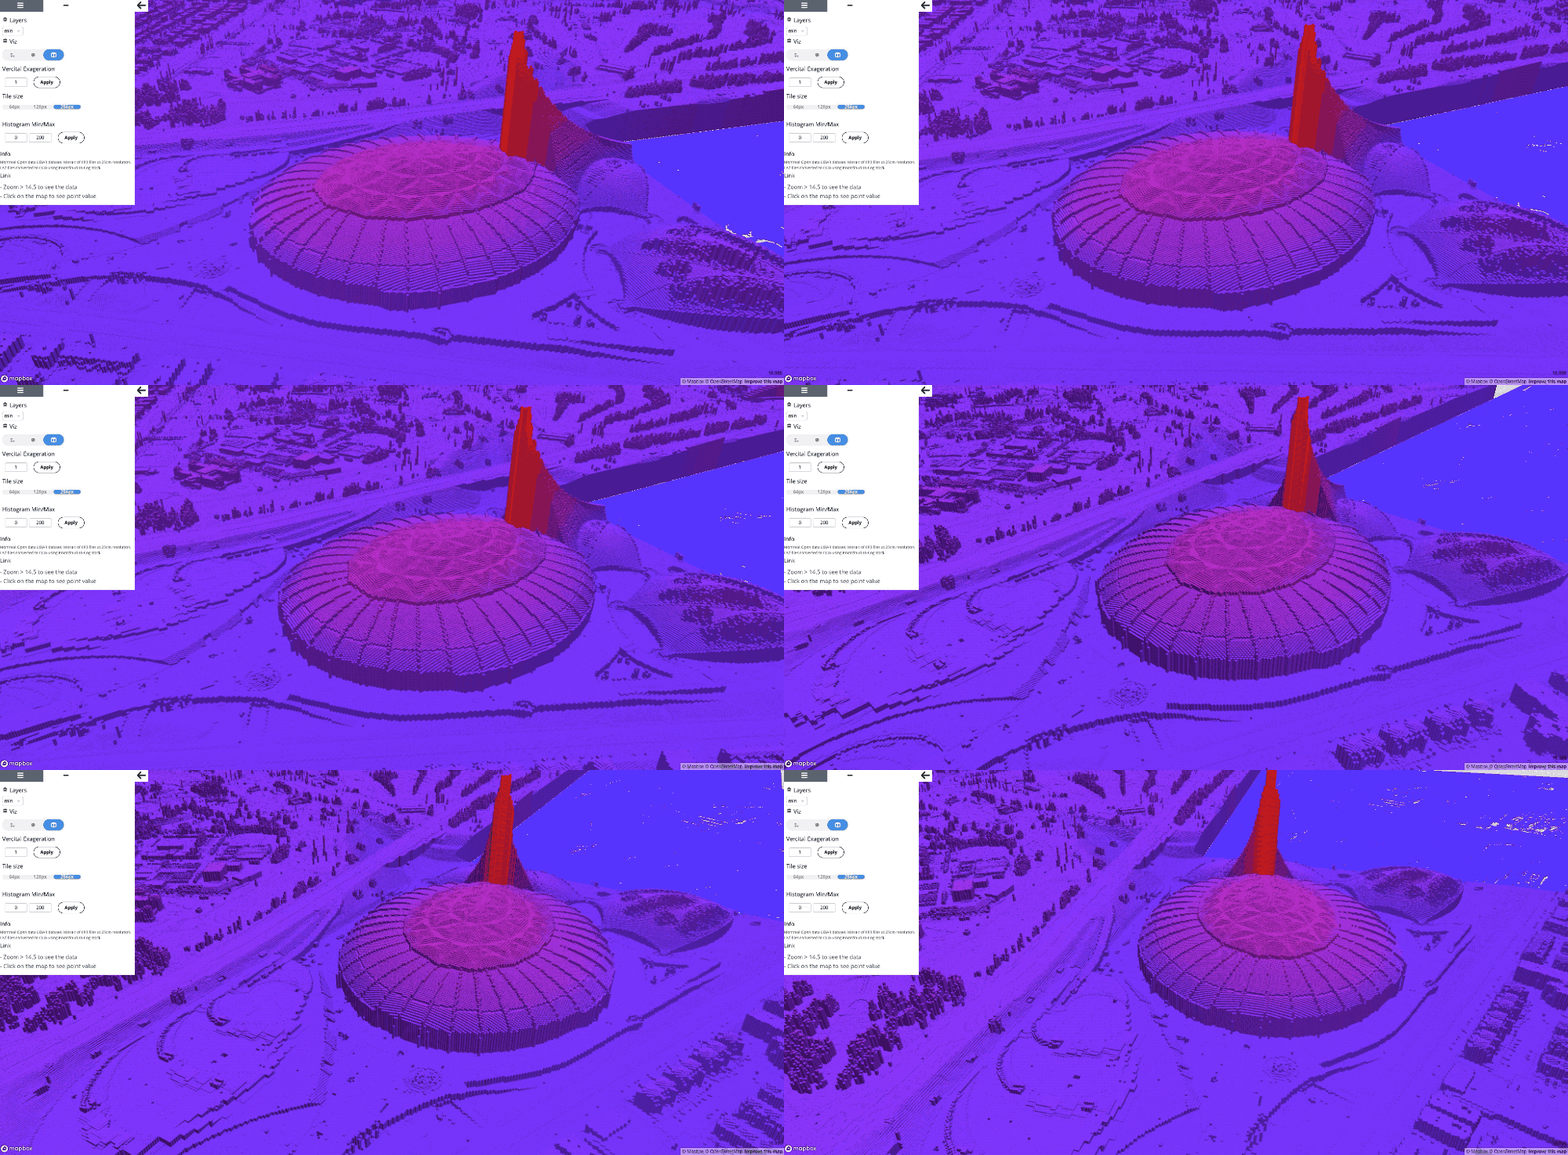
 Using rio-tiler-mvt, introduced in COG Talk part 3, we can also create Vector Tiles from the COGs directly.
.LAZ → COG → MosaicJSON
Here are the steps we took to translate the .LAZ to COG and create the mosaicJSON:
**1. Create list of files to translate**

$ curl http://donnees.ville.montreal.qc.ca/dataset/9ae61fa2-c852-464b-af7f-82b169b970d7/resource/ec35760c-5cbe-44a0-8ad1-30c037174b0a/download/indexlidar2015.csv | tail -n +2 | cut -d"," -f3 > list_of_files.txt

2. Deploy pointcloud-to-cog (a serverless stack based on AWS Lambda to run rio-cogeo at scale).

$ git clone https://github.com/developmentseed/pointcloud-to-cog
$ cd pointcloud-to-cog
$ make build && sls deploy --stage production --bucket my-bucket --region us-east-1

3. Send jobs to queue.

$ pip install rio-cogeo rio-tiler cogeo-mosaic
$ cd scripts/
$ cat ~/list_of_files.txt | python -m create_jobs - \
    -p webp \
    --co blockxsize=256 \
    --co blockysize=256 \
    --op overview_level=6 \
    --op dtype=float32 \
    --op web_optimized=True \
    --prefix cogs/MTLLidar \
    --topic arn:aws:sns:us-east-1:{AWS_ACCOUNT_ID}:pdal-watchbot-production-WatchbotTopic

4. Create a MosaicJSON (using cogeo-mosaic).

$ aws s3 ls s3://my-bucket/cogs/MTLLidar/ | awk '{print "s3://my-bucket/cogs/MTLLidar/"$NF}' | cogeo-mosaic create - -o mosaic.json

5. Use cogeo.xyz to visualize the mosaic

$ curl -X POST -d @mosaic.json https://mosaic.cogeo.xyz/add | jq -r ".id"

> d4c05a130c8a336c..........2cbc5c34aed85feffdaafd01ef

open https://cogeo.xyz/mosaic.html?mosaicid=d4c05a130c8a336c..........2cbc5c34aed85feffdaafd01ef
Got Data ?
We’re always looking for interesting problems to tackle using COGs, if you have a raster dataset and want to learn how COG, STAC or mosaicJSON could help, please feel free to ping me on Twitter or LinkedIn ! And if you are interested in joining Development Seed to help us build technology that helps solve global challenges take a look at our open positions!
What we're doing.
Latest
