Today we’re releasing rio-tiler-mvt, a rio-tiler plugin to create Mapbox Vector Tiles from Cloud-Optimized GeoTIFFs (COGs). It enables better dynamic web map visualizations especially for sparse datasets stored. This is the result of recent work where we had the need to visualize LiDAR data in-browser. We experimented with generating our visualizations on-the-fly by generating vector data directly from the source Cloud-Optimized GeoTIFFs (COGs). While the initial approach felt clumsy at the time, we’ve since polished it up into a proper plugin with impressive performance.
This is the third post of our COG Talk series (check out the introduction in Part 1 and use of COG mosaics in Part 2).
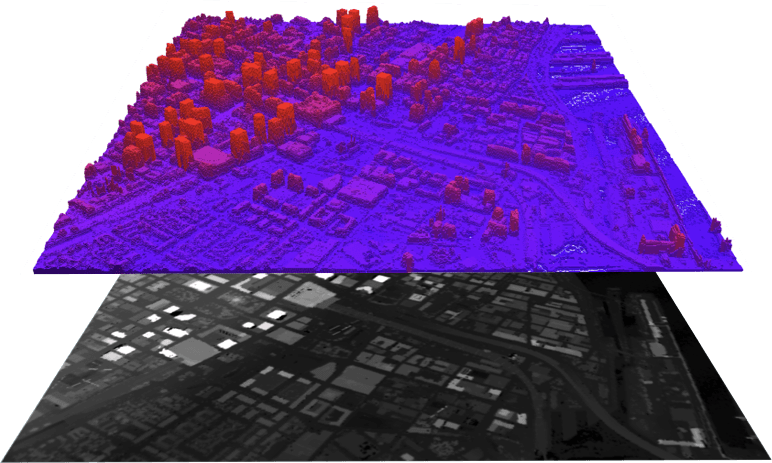 Lidar dataset displayed as vector tiles (top) or raster (bottom). Data from Montreal Open Data.
Cloud Optimized GeoTIFF is an excellent format for storing remote sensing data because the file structure provides a convenient method for data access and visualization. When we want to access a smaller raster — either as an array for analysis or a PNG/JPEG for visualization — we can easily read just that portion of the data. Most tools stop at this point and return a raster value, which is exactly what we want in most cases. But with sparse datasets, this isn’t always the best approach.
The population dataset mentioned in our second post is a great example for showing how COG mosaics work on a technical level because we need to combine multiple large COGs into one seamless product. But when visualizing this as a raster, you’ll notice that the output isn’t ideal because the sparse data makes it difficult to see individual pixels.
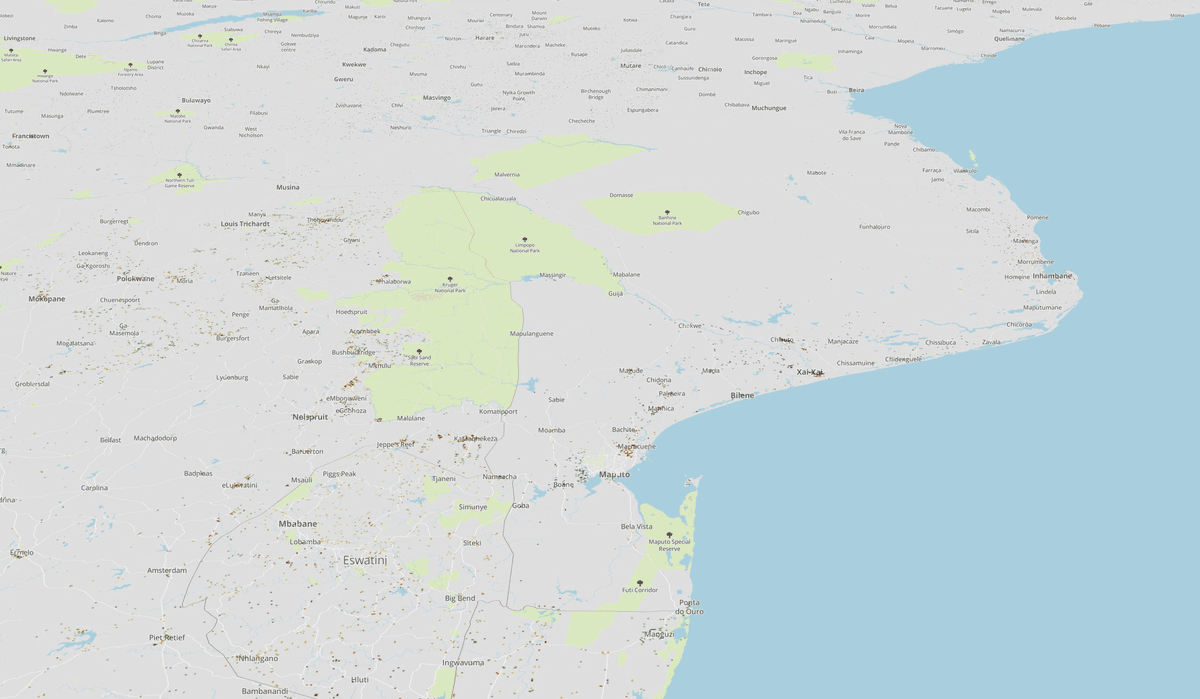 High-resolution population density data from Facebook AI (link) displayed as raster tiles.
To solve this problem, we want more control over the rendering of the data. We would ideally have a simple way to query data from COGs but return data in another non-raster format. For point visualization, Mapbox Vector Tile (MVT) format seems to be a better fit and it also enables client-side rendering and user interaction (e.g. changing colors dynamically and clicking on the data).
🎉 rio-tiler-mvt 🎉
Today we’re releasing **rio-tiler-mvt,** a rio-tiler plugin to encode tile arrays as Mapbox Vector Tiles. We started this as an experiment to see how far we could push Vector Tiles encoding from COG tiles. With some help from Yohan Boniface, we updated the python-vtzero library which enables fast MVT encoding in python (wrapping Mapbox’s vtzero C++ library) and then created this small rio-tiler plugin to convert raster tile values to vector features on the fly.
from rio_tiler.main import tile as COGTiler
from rio_tiler_mvt.mvt import encoder as mvtEncoder

my_cog_file = "path/to/myfile.tif

tile, mask = COGTiler(my_cog_file, x, y, z)

bdescr = ["band1", "band2", "band3"] # Bands Description
layer_name = os.path.basename(my_cog_file) # Name of the output layer

# Translate the tile array to Mapbox Vector tile (protobuf)
mvt = mvtEncoder(tile, mask, bdescr, layer_name,  feature_type="point")
The resulting vector tiles make visualizing sparse data much easier but is surprisingly fast for dense data sets as well.
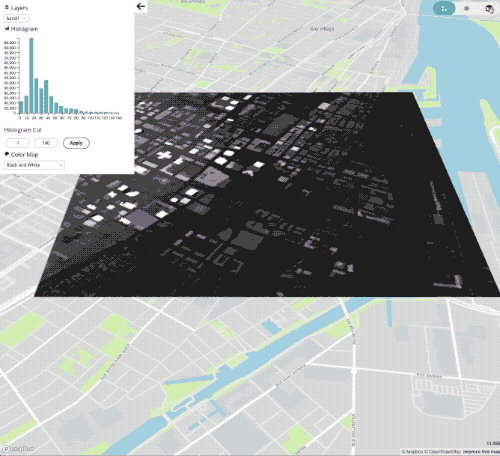 Lidar dataset stored as Cloud Optimized GeoTIFF and served as raster or vector tiles. Data from Montreal Open Data.
And it also works well with COG mosaics, like the Facebook population data from above (link).
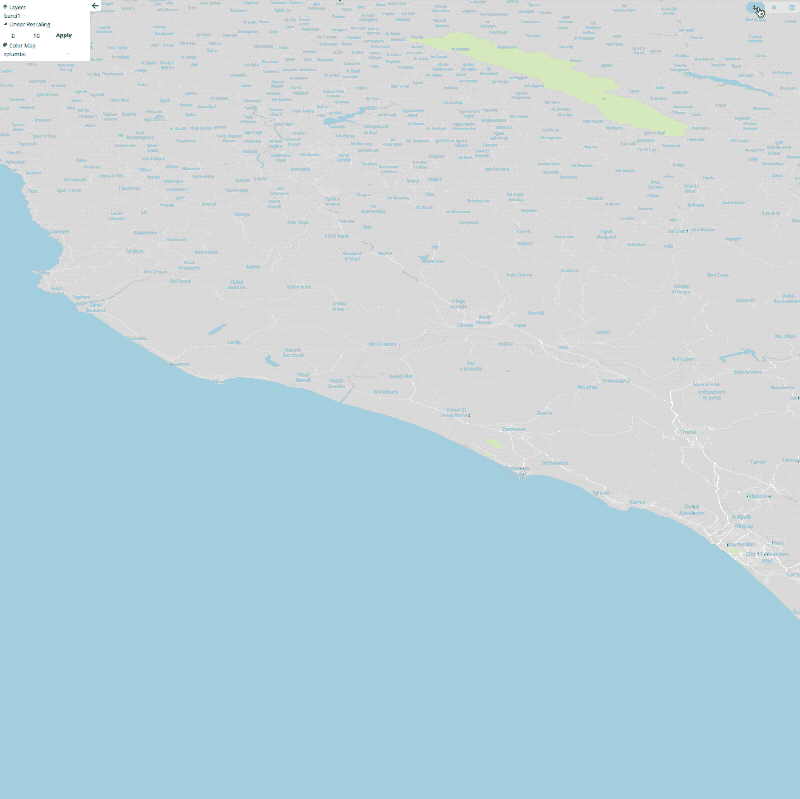 COG mosaic from high-resolution population density data from Facebook AI (link) displayed as vector tiles + extrusion (3d rendering).
⚠️ Important notes:
-
This is an experiment and there is still some work to be done on python-vtzero (issues) to enable better data encoding.
-
A COG is still a COG. When creating tiles at lower zoom level than the raster’s native resolution,
rio-tileris fetching overviews (a downsampled version of the raw data) so the displayed vector value is not always equal to the raw value. -
Does it work with LiDAR data? Yes and no. LiDAR datasets are usually very dense, meaning each tile (256x256px) will create 65,536 points values and might be too much to handle for the web client.
-
Looking forward to VT3. The next iteration of the Mapbox Vector Tiles specification (3) will add better 3D (X,Y, Z) data support (link).
Pushing to the limits
If you are not scared about mapbox-gl-js burning your laptop, you can try this demo in which we use Mapbox's awesome satellite base map and terrain data hosted on AWS PDS to create RGB + Elevation vector tiles and display it as extruded colored polygons (with x2.5 vertical exaggeration).
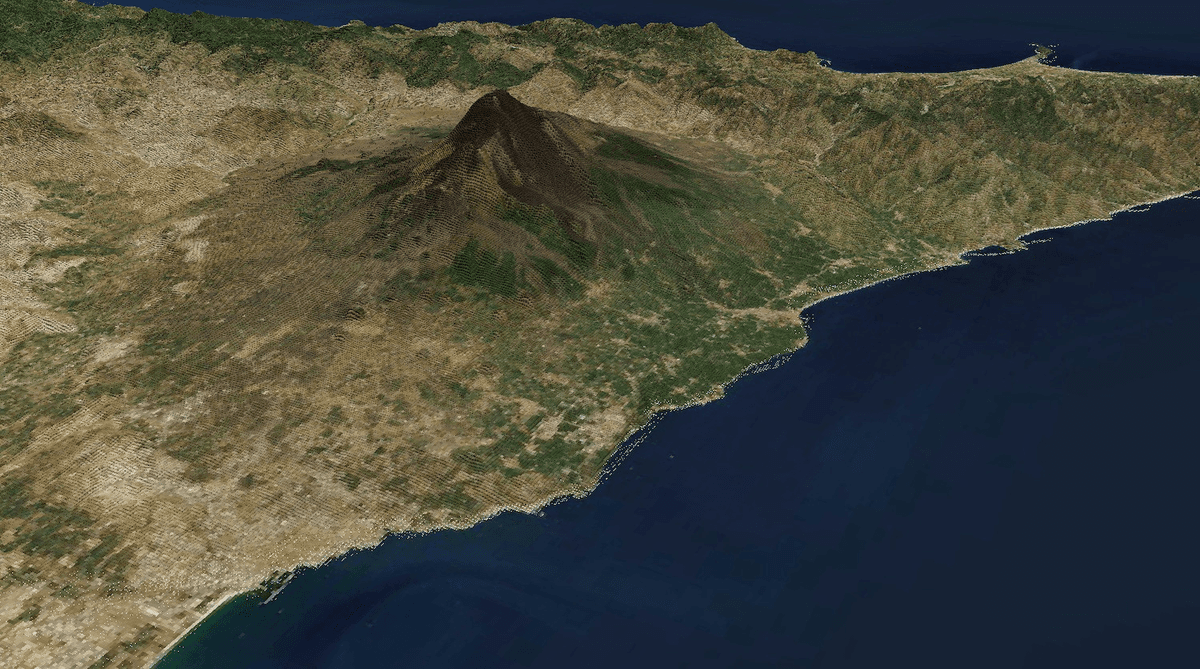 Mount Etna volcano, Italy.
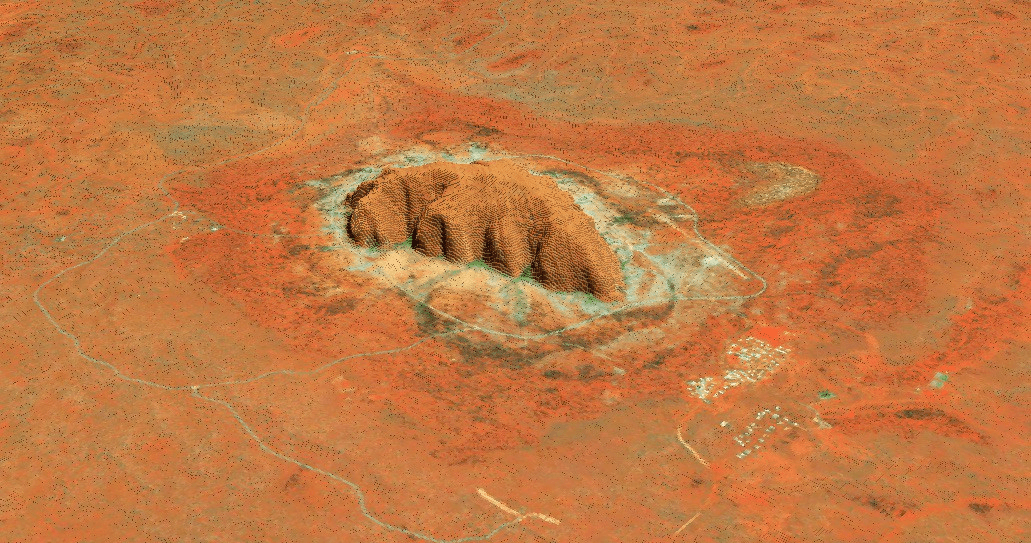 Uluru Inselberg (also known as Ayers Rock), Australia.
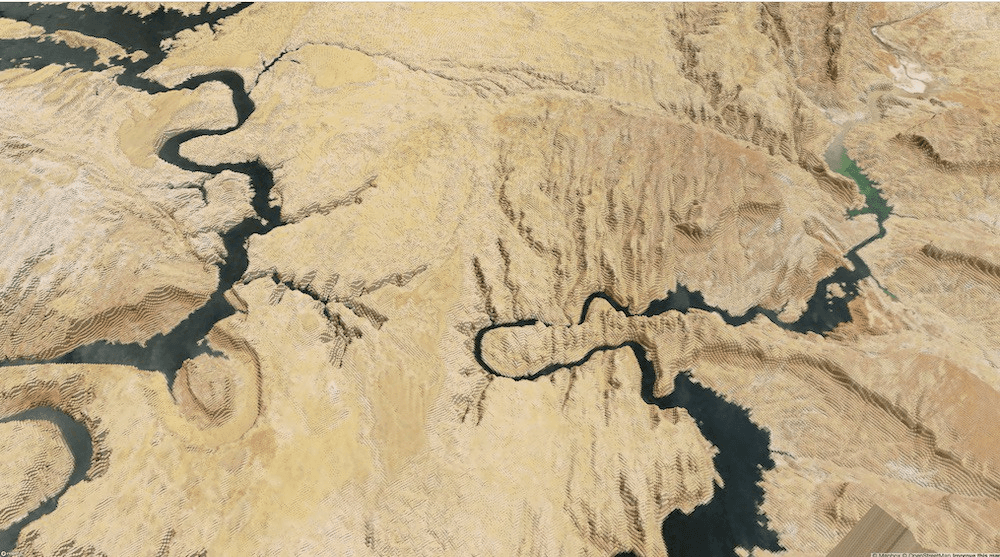 Glen Canyon National Recreation Area, United States.
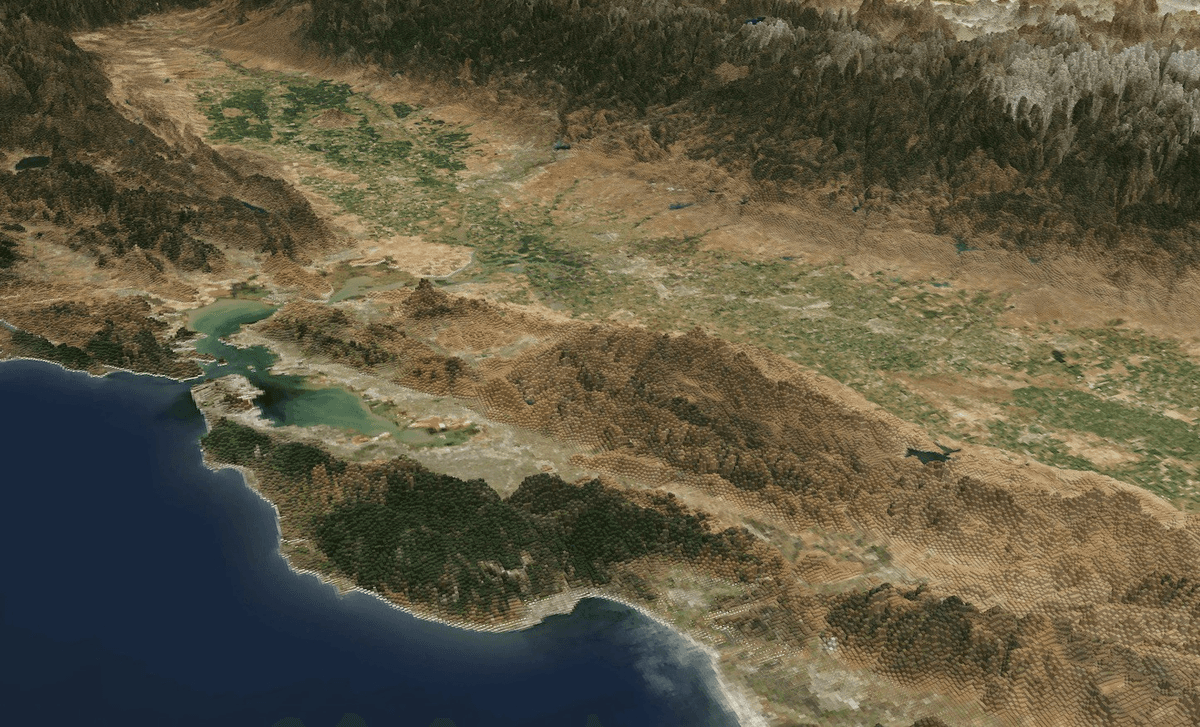 San Francisco area, United States.
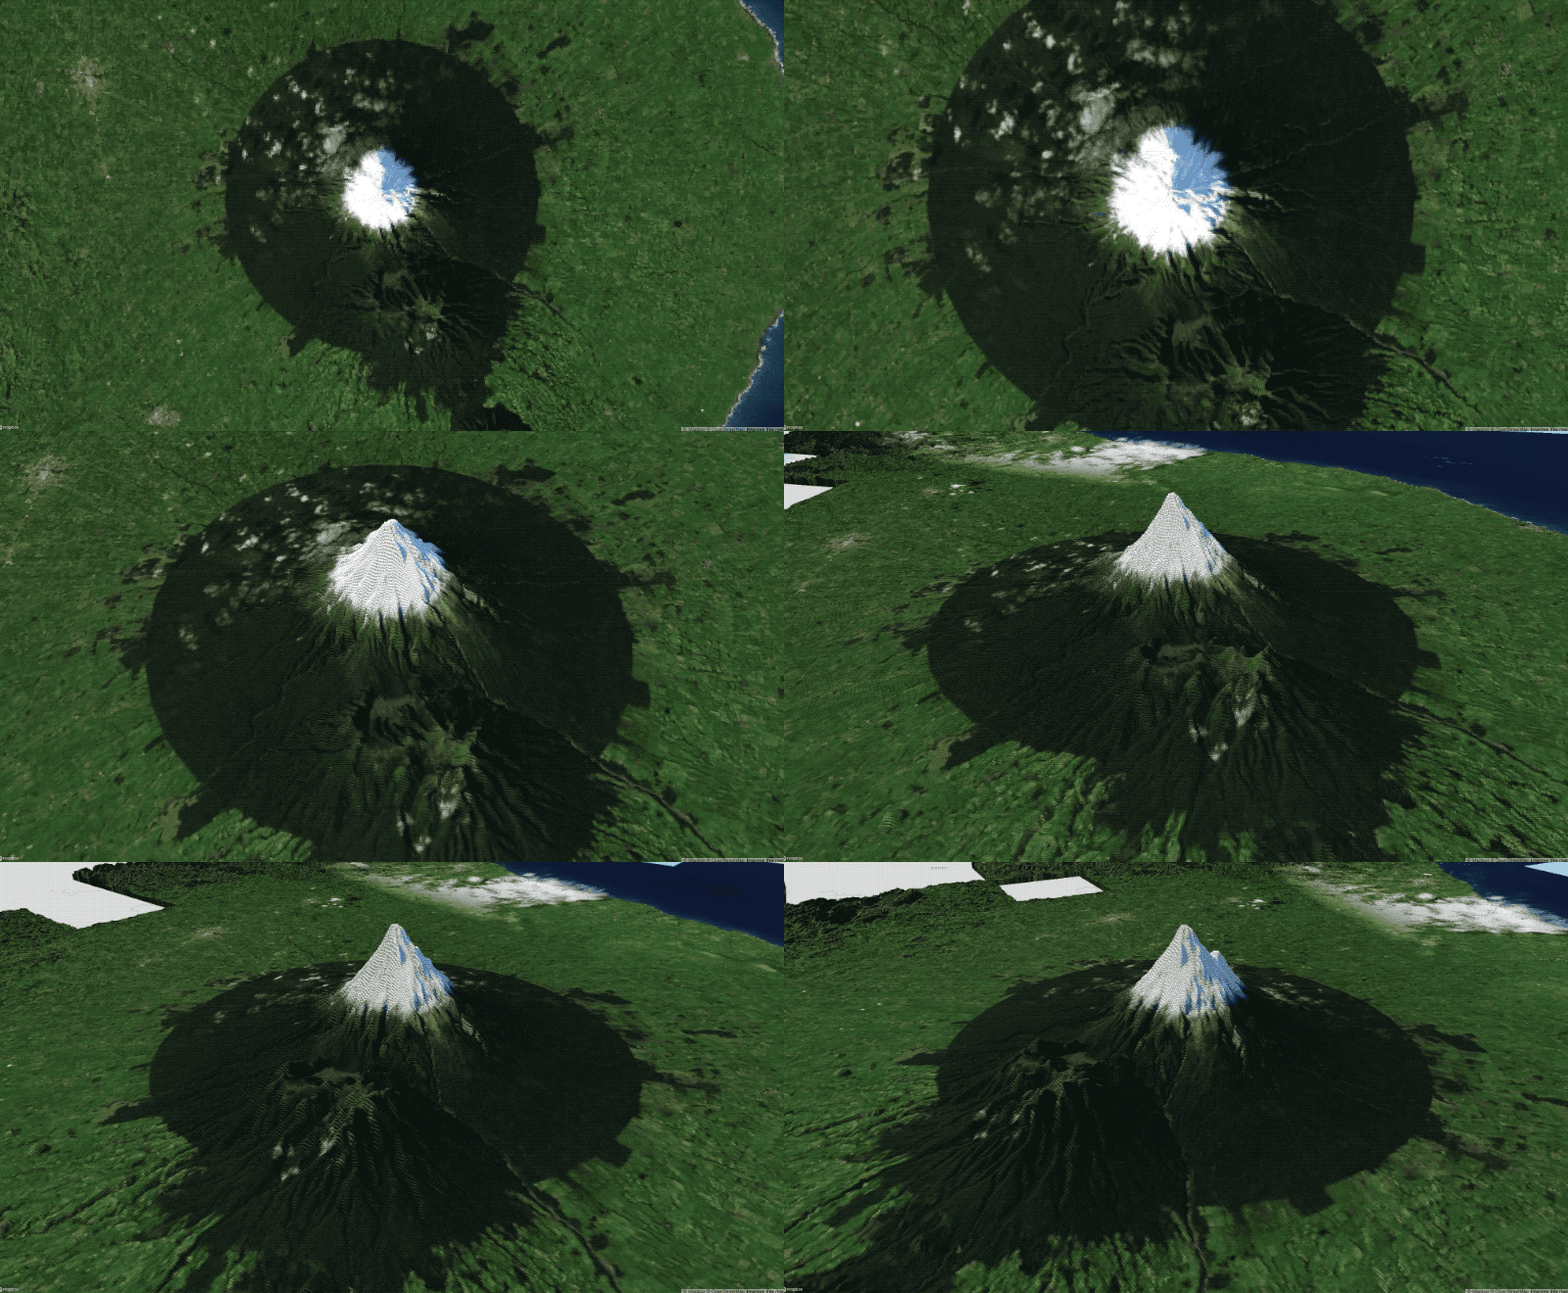 Mount Taranaki, New Zealand.
Please feel free to ping me @_VincentS if you have questions or want to hear more about the work we are doing to make open data more accessible and easier to use.
What we're doing.
Latest
