

Uganda held general elections on February 18th, that were widely criticized by media and independent observers. On Thursday, the Ugandan Electoral Commission released the results in PDF. Many concerns about the electoral process will not be evident in the results alone, however, analysis of the data can still be valuable in detecting some types of fraud.
Evidence of ballot box stuffing
Our preliminary analysis found evidence of blatant ballot box stuffing in concentrated areas. We used “election fingerprinting” to quickly look at the distribution of election returns and identify anomalies.
Election fingerprints are two-dimensional histograms of the number of units for a given voter turnout (x axis) and the percentage of votes (y axis) for the winning party (or candidate)
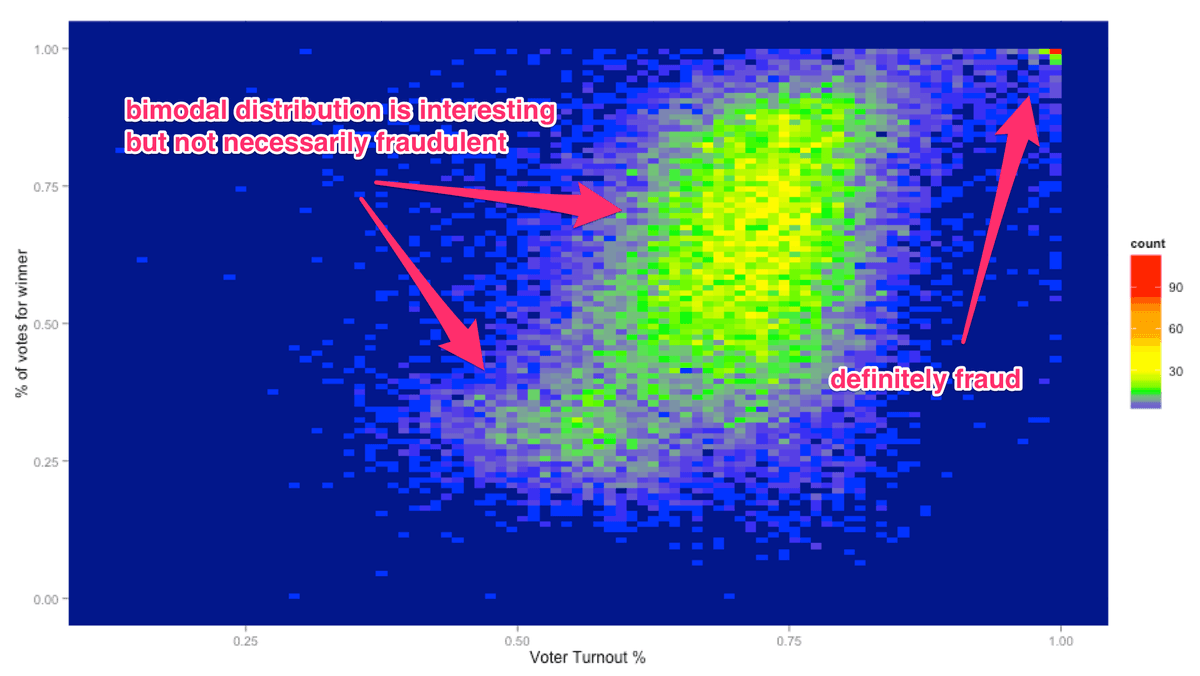
Results in the upper right corner (very high turnout, very high percentage of votes for the winner) are clear signs of ballot stuffing. Bi-modal distributions can arise naturally in certain countries but generally don’t differ by average turnout and are often a sign of incremental fraud.
Of the 28,010 voting stations, 130 of them had 100% voter turnout, 113 of which voted 90% or more for the eventual winner and incumbent, Yoweri Museveni (42,768 votes for him in these stations). 105 of these highly suspicious stations occurred in just 4 districts:
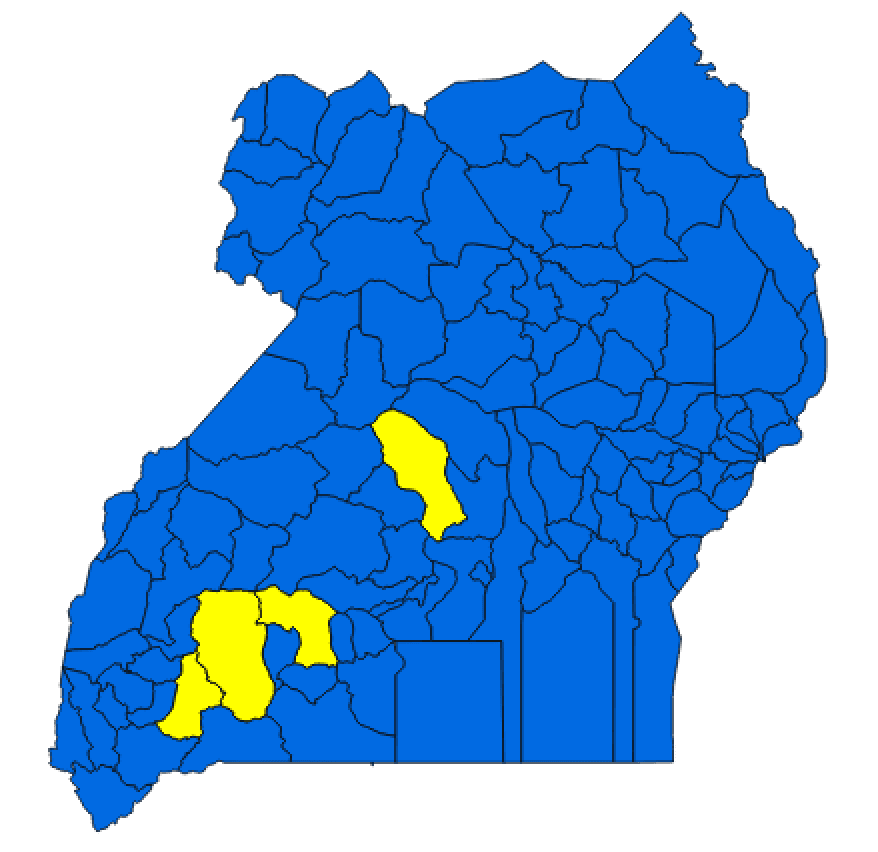 Mbarara, Sembabule, Kiruhura, and Nakaseke
Open Election data
This analysis was possible because the election data was provided at the polling station level by the Ugandan Electoral Commission. To support further analysis of the data, we parsed this PDF and converted it to a machine-readable format (CSV). Because of the size of the file, it was difficult to parse using Tabula so we wrote custom scripts relying heavily on pdfminer.
Truly open elections mean providing timely, machine-readable, and easily accessible results. We look forward to seeing what you do with the data. Find it on GitHub.
What we're doing.
Latest