

Nearly 100 million barrels of oil flow through the global oil supply chain every day. But not all oils are created equal. When you consider the full oil processing lifecycle, some types of oil are responsible for nearly twice as much greenhouse gas as others. This is important information for oil procurement and energy policy. Smarter oil selection can lead to significant reduction in greenhouse gases without even touching overall oil consumption. We worked with the Carnegie Endowment to launch the Oil Climate Index website to help consumers and policymakers make smarter decisions on oil.
Extracting Oil Data
Oil emission data has traditionally been extremely hard to find. The source data for most oil fields is often secret and some of the models needed to calculate total greenhouse gas emissions have been proprietary. The Carnegie Endowment made a major contribution to understanding the climate impacts of fossil fuels with the Oil-Climate Index. The Oil Climate Index is the first study using entirely open-source models for evaluating greenhouse gas emission. These models were developed in a collaboration by Carnegie Endowment’s Energy and Climate Program, Stanford University, and the University of Calgary. In addition, the Oil Climate Index also collected model input data for 30 popular and emerging oils.
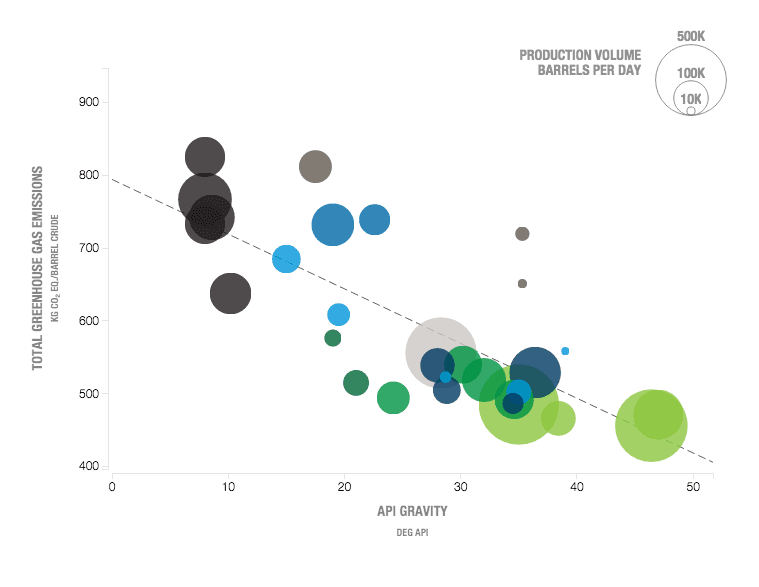 Explore relationships between oil properties
The data is extremely complex and nuanced. Depending on what you want you want to do with an oil, making diesel vs jet fuel, different oils may be better. An improvement in an extraction or refinement process may have a significant climate benefit for one oil but not for another. To make this data useful to scientists, investors, policy makers, and interested citizens we built a flexible data exploration tool. The tool makes reasonable assumptions to allow immediate comparison, but also allows users to explore how specific factors change the overall climate impact of each oil. Most importantly, all of the data and the modeling methodologies are open and available for download.
Designing for complexity
We limited graphing options to the most meaningful properties to provide flexibility without unnecessary complexity. To visualize the Oil-Climate Index, we weren’t just showing static data, we were visualizing results of complex models. Processing all the data in the browser is impractical. Instead, we picked several model input parameters that are most meaningful and calculated their data up front. We built processing tools behind the site to recalculate this data as Carnegie extracts data on new oils.
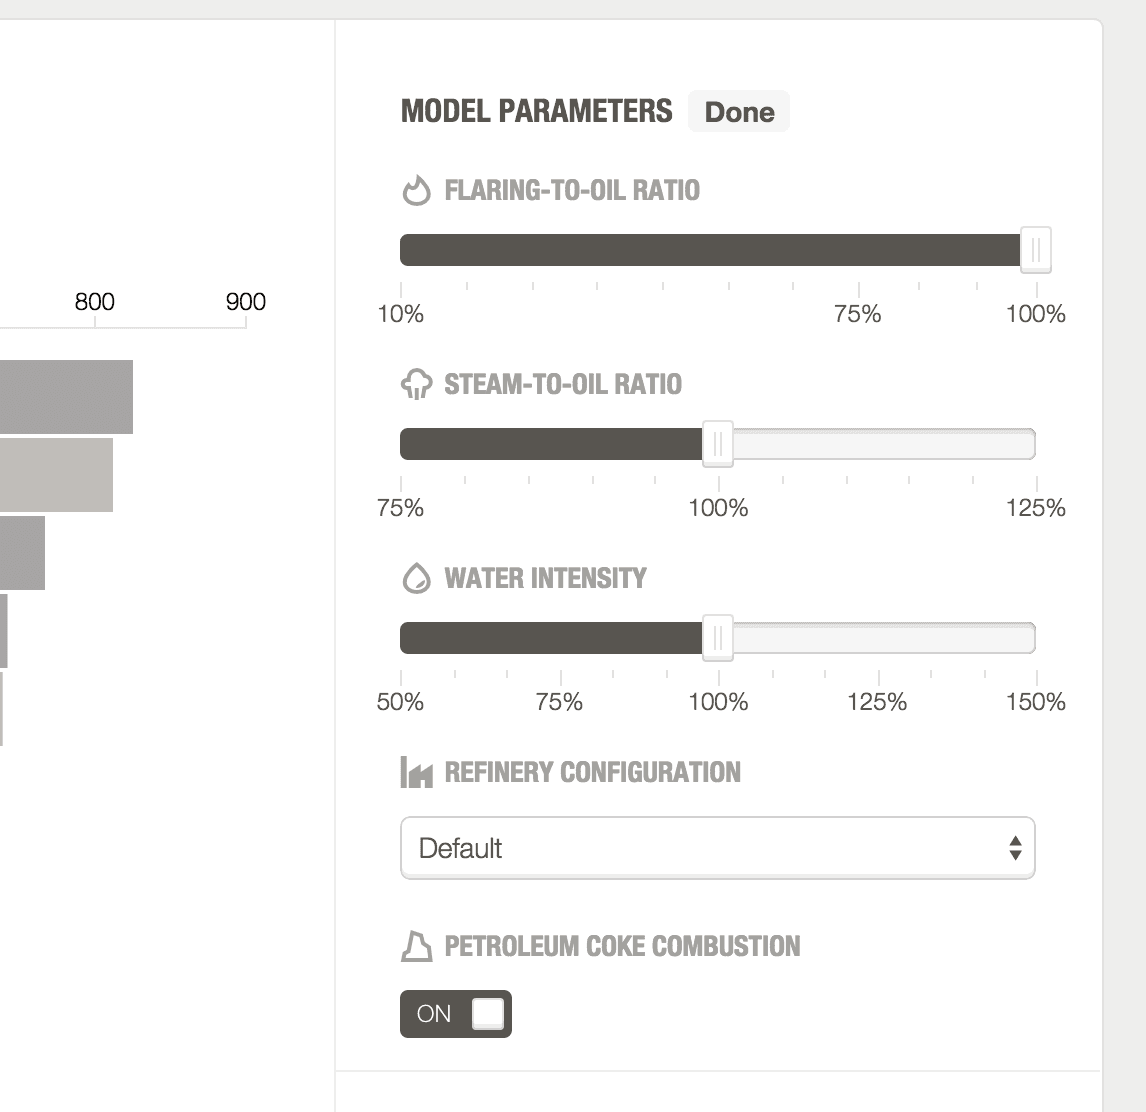 Model parameters allow the user to customize the model and data output
For more information on the Oil-Climate Index hit us on Twitter, ask @DxGordon, or check out these resources:
What we're doing.
Latest