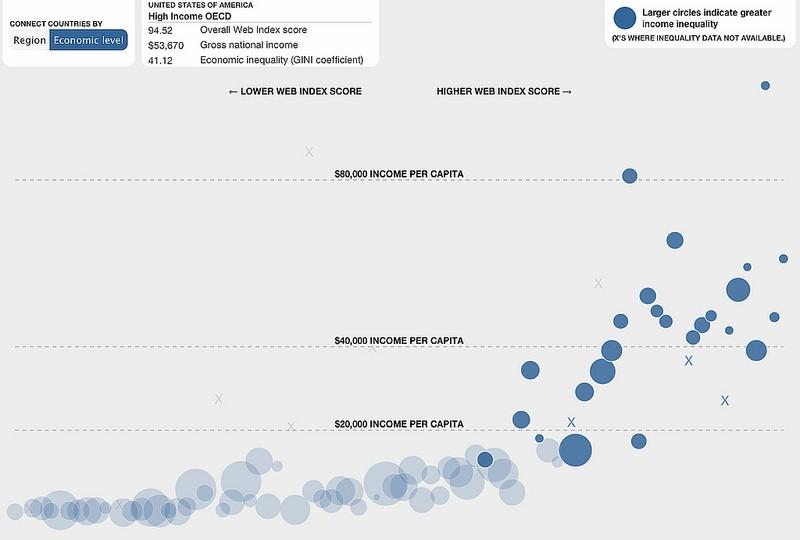
The World Wide Web Foundation released their 2014 Web Index, an annual accounting of how the internet has changed the economic, political, and social lives of citizens across every continent.
This is an ambitious and complicated story. The impact of the internet on the 84 countries in the 2014 report is difficult to isolate from culture, politics, and economics. Ultimately, the report found that open and inclusive internet correlate to equitable societies. The report is rich with data and worth reading in full.
Visualizing liquid data
Making useful and appropriate comparisons between 84 countries is hard. To create the Web Index, the Web Foundation pulled a range of primary and secondary data into normalized indicators, which together comprise the index. The report, produced online in collaboration with WESO, gives a global overview in addition to nuanced subviews on topics such as internet censorship and gender equality.
When we first began collaborating with Web Foundation to visualize this information, they were in the process of collecting and interpreting their data. They had identified key themes that they knew would be important: economic equality, neutrality, censorship and surveillance, and gender-based violence, among others.
Using these leads, we dived into the preliminary results in search of effective, telling visuals. Quick feedback loops and frequent communication with research specialists at Web Foundation helped us to build better visuals. It also helped Web Foundation better understand their data and how to communicate it.

Comparing Countries
We ran up against the challenge of showing 84 countries in interesting ways, while doing justice to the data. Although the data is country-level, not every story lends itself to a map. In our visuals, we use flags, bubbles, and names to indicate countries.
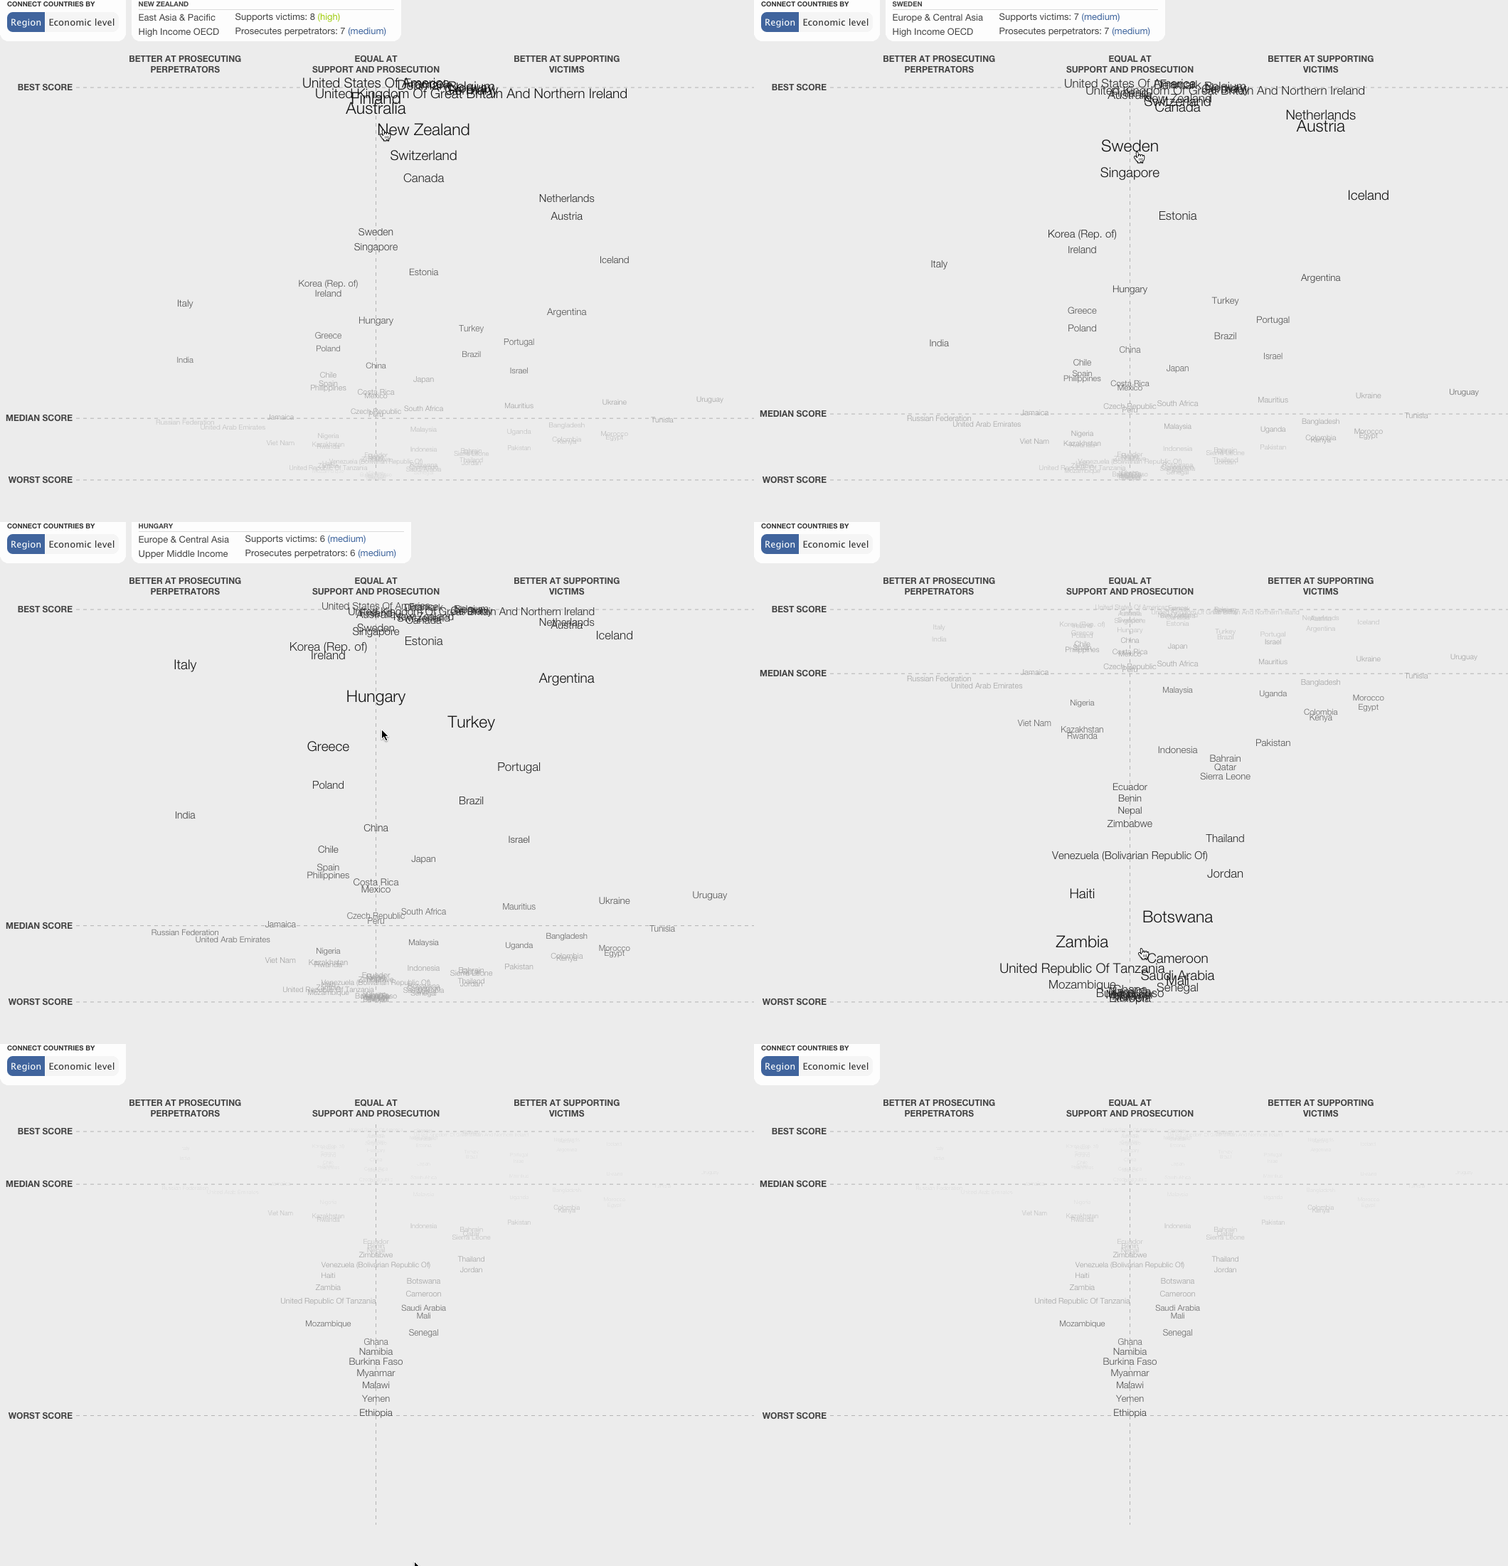
In plotting gender-based violence, we ran into the problem of page size. The graph examines countries with stark differences in how they support victims of online gender-based violence, and how frequently they prosecute perpetrators of that violence. Each graphic had to be single page and embeddable. To make this fit, we used a fisheye effect that moves with your cursor.

Open Data about the open Internet
The Web Index is fully open. You can download all of the data here. The Web Foundation and WESO built an open API with data from this year and previous years. The code for their site and our four visualizations are open as well.
What we're doing.
Latest
