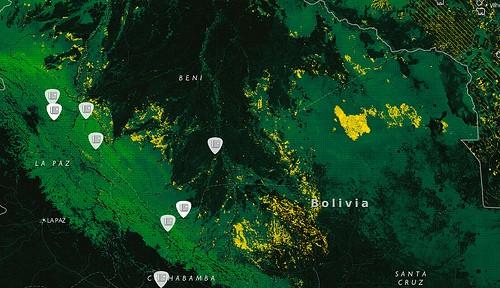
InfoAmazonia Now Maps Deforestion in All Nine Amazonian Countries
- Estimated
- 1 min read
InfoAmazonia now maps deforestation data for the entire Amazon basin dating back to 2004, revealing how forest loss patterns play out in different countries. When O Eco, Knight-ICFJ, and Internews first launched InfoAmazonia ahead of the Rio+20 earlier this year, deforestation data was only available for Brazil. This addition brings deforestation data from all nine Amazonian countries into one map, using data from Terra-i. Now journalists and others can locate deforestation information across the region in diverse political, social, and environmental contexts.

Through InfoAmazonia’s partnership with Terra-i, we get this deforestation dataset as clipped shapefiles, allowing for integration with other data sources like INPE that were already included in InfoAmazonia’s deforestation map and updated monthly.
With Terra-i processing the data for us, I pulled the shapefiles directly into TileMill for styling. Since the data contains a column called xtra1_YEAR describing the year each area was deforested, it's easy to highlight the most recent changes with some simple CartoCSS:
#ternobra {
  polygon-opacity:1;
  polygon-fill:#ffd500;
  line-color:#ffd500;
  [xtra1_YEAR = 2012] {
    polygon-fill:#ff2c00;
    line-color:#ff2c00;
  }
}
The new Terra-i layer is then uploaded to our MapBox account, and overlayed with the other deforestation layers using the MapBox API.
We’ll be updating deforestation data on InfoAmazonia every three months, in sync with Terra-i releases. Deforestation data for Brasil from INPE will continue to be updated monthly, in addition to the latest stories from O Eco and others.
What we're doing.
Latest