Journalists in Afghanistan routinely face violence, intimidation, and threats that undermine their ability to produce quality reporting. This seriously limits media freedom in the country, affecting the work of civil society organizations (CSOs) and reducing the efficiency of development efforts in the country. The scale and frequency of the violence can be hard to grasp, but Nai’s MediaWatch team, in partnership with Internews, is collecting and aggregating hundreds of detailed reports through the country. Today’s launch of data.nai.org.af opens all of this data to the public and visualizes it on an interactive map for the first time.

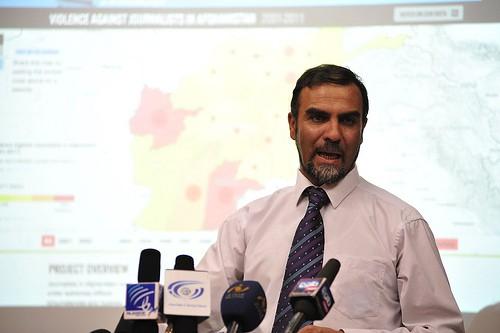
Sediqullah Tawhidi, the Head of Nai’s Media Watch, announces the opening of data on violence against journalists in Kabul, Afghanistan.
Presenting data in an open way like this enables a broad set of actors, from CSOs to citizen journalists, to easily engage with the data. Prior to this site, Nai’s data sat in spreadsheets and, while distributed to select individuals, was not broadly disseminated. The site makes Nai’s data truly accessible, allowing visitors to quickly visualize aggregate trends over the past ten years and dive into specific years to see details on hundreds of incidents.

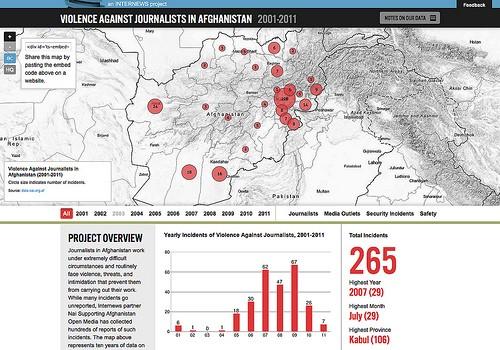
Homepage of data.nai.org.af showing an aggregate look at violent incidents against journalists in Afghanistan.
Interacting with the data
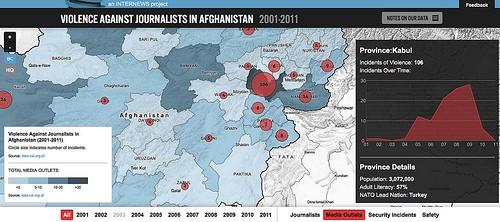
All data is geotagged at the province level on the map. The size of the point represents the number of reported incidents. Mousing over any point shows the historical trend for that province. To add context to the incidents, the site allows visitors to view additional maps along with the incidents. These maps include the number of journalists and media organizations operating in a provinces, security incidents in a given province, and a safety index provided by Nai.

Contextual overlays quickly show more related data.
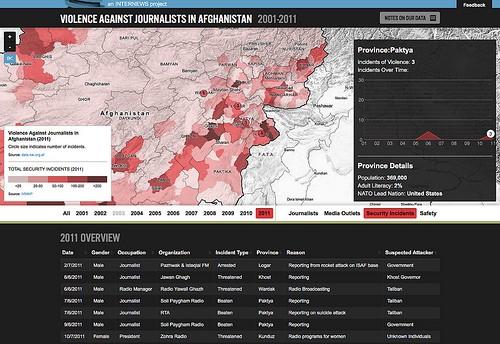
Visitors can quickly filter data by year. Each year filter displays the original data under the map to let power users see all the details. The listing of data is fully interactive, so you can select a column and the data will filter for you. Clicking on any provincial point brings up just the incidents within that province.

Filter data by year to see how incidents have changed.
With this site we intend to help raise the profile of this issue and allow media, civil society, and government to understand its breadth and trends. Furthermore, by allowing other CSOs and the public to interact with Nai’s data like this we hope to set a tone of collaboration, networking, and data sharing among Afghanistan’s CSOs, media sector, and civil society at large. Ideally all organizations, even those not currently focused on media, will understand and support media freedom.
Building with open source
The site is built using all open source tools. The maps were designed using TileMill, our map design studio. We have led capacity building with the local staff of Nai and Internews this week on how to use TileMill, including training sessions on adapting current workflows to produce map-ready data to strategizing around map design. The site is lightweight and uses only HTML, CSS, and Javascript, leveraging the power of Wax, a collection of tools that make it easier to publish custom maps. Using these open source tools is critical to ensuring the long term sustainability of this site as Nai’s dataset is growing every day. Nai also hopes to soon translate the site into Dari and Pashto.
We’ll continue to work with Internews to share lessons learned while building this site and explain how to replicate this project to the international Internews community. If this work interests you, check out the Committee to Protect Journalists, which has a number of impressive activities taking place around the world.
Notes
Nai and Internews: This work is one part of a much larger effort to improve media freedom. Nai and Internews are also funding and implementing other projects designed to support and train local journalists.
Development Seed: We are an innovation parter with Internews Afghanistan working on AMDEP (Afghanistan Media Development and Empowerment Project). In this endeavor we are focusing on mapping and visualizing data to increase CSOs’ ability to analyze complex information quickly and efficiently. We’re also participating in the Open Data Initiative in Afghanistan to help build capacity and leverage open source tools to enable local civil society groups to analyze, map, and share data.
What we're doing.
Latest