A Basic Mapping Mashup Completed with Open Data and Cross Agency Collaboration
- Estimated
- 2 min read
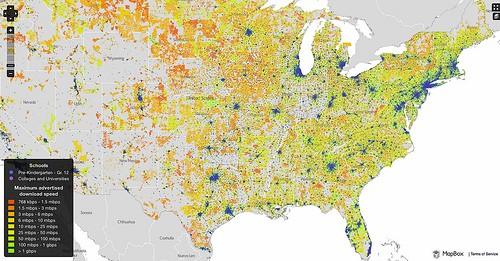
The U.S. Department of Education’s new broadband mapping initiative Maps.ed.gov/Broadband is a great example of how open data is helping increase efficiencies and collaboration between federal agencies. The site is a basic mashup showing where broadband is available in relation to schools and colleges. What makes this map incredible is that this broadband data did not exist a month ago — it was just opened up for the National Broadband Map in mid-February.

Chain of collaboration: NTIA collected the data → FCC opened it up → and the Department of Education mashed it up with other data to show it in their own context.
This release of data, and its ultimate processing into a custom map for the Department of Education, involved the work and collaboration of several key agencies, along with some amazing open source software. First, the National Telecommunications and Information Administration (NTIA) collected and processed the data, and then the Federal Communications Commission (FCC) ran point on building out broadbandmap.gov. The FCC and NTIA used the data to make a lot of their own maps, and they also opened up the raw data.
Once the data was released publicly, we worked with the Department of Education to download it, process it in PostGIS, merge it with the US TIGER 2000 census maps (aligning it with the 8.2 million census block IDs, of which 5.2 million(ish) have broadband data associated to them), and design the map. Because of the massive size of the data — we used 12 gb of raw data and turned that into a 7 gb PostGIS database — we used Mapnik to generate the map tiles down to zoom level of 12. We then used TileMill to design the custom overlay of schools and universities. Finally, the map tiles are hosted in MapBox’s cloud servers, something we will be talking about more in the coming months.
The end result is that within four weeks of the broadband connectivity data being released, the Department of Education was able to plot this data alongside its own school data to show the significance of internet access to the U.S. education system. Karen Cator, the Director of the Office of Educational Technology at the Department of Education blogged about why this mashup matters:
The Department of Education’s National Education Technology Plan sets a goal that all students and teachers will have access to a comprehensive infrastructure for learning, when and where they need it. Broadband access is a critical part of that infrastructure. This map shows best data to date and efforts will continue to gather better data and continually refresh the maps.
What we're doing.
Latest