
We’re working on adding fast interactivity to data-heavy maps. You can see this working on two historical mapping sites we launched with the National Democratic Institute for the 2004 and 2005 elections in Afghanistan. In short, it’s now possible to hover over map tiles and see the specific data they contain.
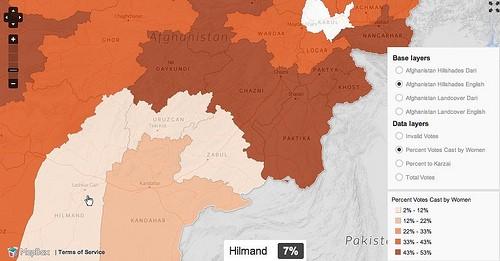
This kind of interaction — which provides hovering and clicking behaviors to otherwise flat raster map tiles — is now possible without using Flash while still supporting older browsers like Internet Explorer. This is the result of a great deal of work involving raw performance, data interoperability, and compatibility across systems — taking advantage of the OpenLayers mapping library and the Mapnik map rendering toolkit.
How this works
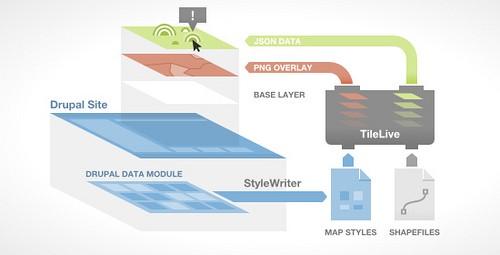
Drupal and other content management systems can manage numeric data within its own structures. In the case of the Afghanistan election maps, the Data module contains the tabular data that eventually colors the map. When each map is initially viewed, data from Drupal is pulled onto the TileLive map server hosted by MapBox.
TileLive draws tiles that are not yet cached and directly serves tiles that it has rendered before — making cached map performance extremely high. TileLive also generates “tiles of data” that indicate what features exist where in each tile, and saves them as JSON. Then using a simple collision-detection algorithm, the site can determine which, if any, feature the mouse is hovering over and deliver underlying data for popups and navigation.
There are a few important notes to the implementation.
No Flash
Many other interactive maps use Flash, and for good reason — it provides a fast vector-drawing system that functions somewhat across browser and across platforms. Flash makes polygon interaction somewhat inexpensive, as well.
However, Flash doesn’t have the rich array of libraries and mapping tools that are available in Javascript, and we’d like interactivity to be easily combined with existing mapping solutions as well as new devices like the iPhone and iPad. With a hybrid solution of rasterized images, tiled vector data, and simple standards for communicating throughout, supporting new backends and frontends is possible.
No Vectors
While browser-based vector rendering is certainly the future, and mapping libraries like polymaps and Cartagen are paving the way for fast javascript implementations, popular mainstream websites need to maintain compatibility with Internet Explorer. We’ve found that even rendering scaled points in IE’s VML environment can be unbelievably slow, and even older versions of Firefox on older systems can slow to a crawl with complex vector data. Thus this approach to interactivity is designed to avoid using any sort of vector drawing interface — Canvas, SVG, or VML — and instead relies on efficient interaction code and fast rasterization by Mapnik.
Low Requirements, High Speed
The server component of this interactivity, called TileLive, is designed to scale to thousands of concurrent users, thanks to a few simple aspects of its design:
-
Cacheability: After a request for an image or interaction data is filled, the file is stored to a cache. After that request, that file can be served directly from the web server without invoking the application. Currently cached files are served by the minimal and fast server nginx. One of the important elements of this approach is that the JSONP callbacks are made to be predictable on both sides due to perfect hashing. In the future, this means that we can use a proper CDN for interaction data.
-
Lazy loading: Interaction data is only loaded on a mouse hover. For cached data, which is rarely larger than 1K, this loading will seem instantaneous. And for users who don’t scroll to a map below the fold or who don’t use the map, having interactivity available doesn’t slow down page loading.
-
TileLive and the StyleWriter module (more on that below) enable data to be joined together. We are now working to add this into data.worldbank.org, which has thousands of indicators from an external API that can be symbolized in different ways. The traditional model of the map server owning all data in a single place falls flat in the highly linked area of large datasets. Permitting data to be joined on the fly and map styles to be created outside of the map server fits these difficult use cases much more closely.
As far as data, this system is designed for applications that don’t necessarily own their own geodata. The assumption that map servers have full access to map data and configurations from startup is extinguished and replaced with real-world abstraction of data, geodata, and configuration. This means that our map servers are not necessarily the same as servers for Drupal — and that a single Drupal site can use multiple map servers for performance. We see MapBox potentially offering this as a service down the road.
Consistent Hashing with JSONP
The best technique of transferring dynamic data between servers is currently via JSONP — a version of JavaScript Object Notation that uses functional padding to be embeddable as a script tag, therefore avoiding the same domain policy enforced by all browsers.
However in its native implementation, jQuery uses an unpredictable callback for JSONP, making it seem like a dynamic server is required for JSONP. This restriction can be avoided, making the server’s response entirely cacheable. Simply create a perfect hash of the resource part of the URL — in this case, a variation of base64 encoding that can be used in Javascript function names. So each URL has a consistent but unique callback function, and the JSONP can be served via a CDN or off of a file system by a fast server.
Integration with Drupal
Drupal integration happens through the StyleWriter module. Any data source that integrates with the Views module, like the Data module, can be used to power choropleth, point, and scaled point maps via StyleWriter. TileLive and the interaction stack is completely modular, so the Drupal StyleWriter module is only one possible provider of Cascadenik styles to TileLive.
Grids and MetaWriters
Two different kinds of data are returned from this stack: grid data for polygon interaction and GeoJSON for point interaction. These two are generated by different mechanisms and for different reasons.
MetaWriters
MetaWriters are a new feature of Mapnik2 developed by Hermann Kraus that enable the output of GeoJSON data along with image data — so that everything Mapnik renders is accompanied by a record of the actual features rendered and where they were placed within a map tile.
In this implementation, the GeoJSON written by Mapnik is immediately wrapped as JSONP. Then GeoJSON is loaded tile-by-tile and stored with each tile object. Thus thousands of points can be scattered across a map, but only those of interest to the user are loaded, and only those within the currently-hovered tile are iterated through at any given time.
Grids
Polygon interaction is powered by grids: essentially pixel grids which indicate which polygon is contained in which four-pixel square of an image. These are compressed by both run-length encoding and gzip compression on the Nginx side, making the download size small enough to be generally unnoticeable.
The other benefit of grids for polygons is that interaction can be extremely fast: once a grid is associated with a tile, determining the specific district or country the user is hovering over can be done in a single calculation with no loops — making it seem instant.
This is an early technical look at our most recent MapBox investing. While we are deploying this for production ready sites right now, this is still really technical to setup. We are working on making this easier.
What we're doing.
Latest