
Opening Up Data on International Public Health: Center for Health Market Innovations
- Estimated
- 4 min read
Results for Development just launched the Center for Health Market Innovations (CHMI), a project that opens up data on and maps public health projects happening around the world. This portal represents an important open data advance for the global public health community. The site currently profiles hundreds of private sector health programs and allows practitioners and researchers to filter, map, export, and even add to the data to produce better analytical research in the global public health sector. It also has a “pipeline” feature that encourages colleagues in the field to add data on projects that aren’t currently profiled, in one of the project’s efforts to expand its coverage.
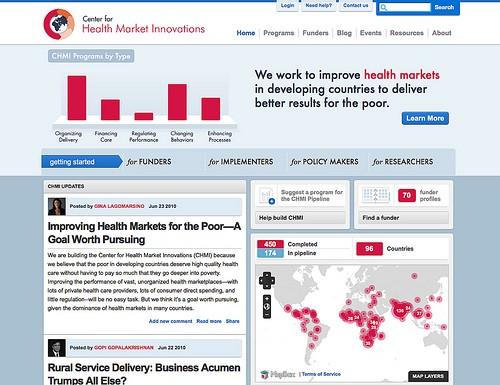
CHMI has an ambitious goal: to improve the capacity of global public health professionals to analyze the success of various approaches to delivering health care to the poor. The project is setting out to collect a huge amount of operational data related to innovative private sector health care businesses, programs, and social enterprises around the world and then evaluate that data to see which approaches are working and which aren’t. It’s an important project in the field because, to date, much of the writing done on these kinds of initiatives is anecdotal or retrospective — outlining what has been accomplished by a specific program, but not making broad statements about the impact of a broad type of project approach.
One problem facing CHMI is that with no precedent for this kind of analysis, it’s not clear what data is most relevant to collect, or even how many relevant programs might exist. When we started working with their team to plan for their Drupal website, we knew we wanted to focus on a few key elements to make the data they do have very accessible, while keeping the site flexible so it can grow as they continue to add to the database and gather feedback. This led us to focus primarily on search, some key data visualizations, and a disciplined approach to the build process that anticipates future iterations of the site.
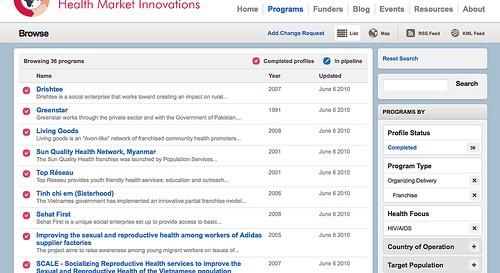
Users needed ways to search and sort through the data to figure out what data exists. As Young mentioned in his post on views driven search, we’ve been working on improving faceted search options through our Searchlight project. This site was our first opportunity to use Searchlight in a production environment to provide faceted searches for users. Using Sphinx as the search backend, we were able to put together a powerful faceted search interface that lets users experiment with different ways to view and sort the data in support of their analysis work.
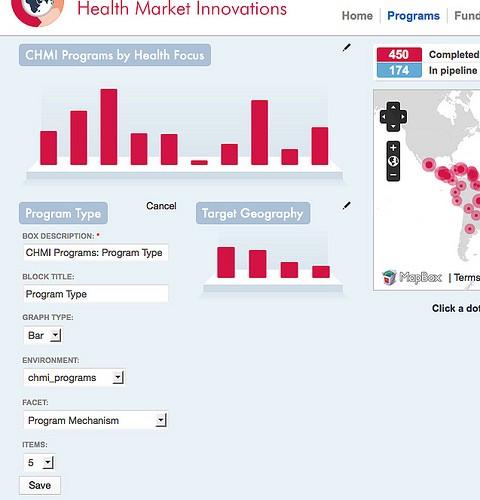
Building on the Searchlight work, we wanted to make sure the data could be visualized in some key ways that let users see coverage gaps and draw other conclusions visually. Leveraging our work on Data.WorldBank.org with the Boxes module, we built a Boxes plugin that lets CHMI’s team show bar graphs and pie charts of any of their taxonomies. The graphs are drawn with the gRaphäel javascript library and use the Drupal Raphäel module (thanks @mikl!), backed up by Searchlight to provide the term counts.
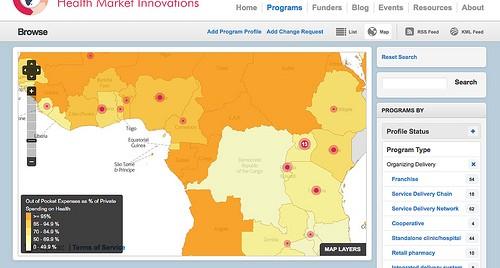
Since all of CHMI’s program data has an intrinsic geographic aspect, we also made the faceted search results available in a map view on top of MapBox maps. To provide users with important economic context when looking at the program data, we created additional supplemental data overlays with TileMill like “Out of Pocket Expenses as % of Private Spending on Health” from the World Health Organization.
We built everything on the site using the Features module, and we used an install profile and a Drush Make file to manage the build — an emerging best practice combo for Drupal development. (If you’re curious to learn more, Jerad Bitner describes this process in his post about Site Development Workflow.) What ended up being especially cool about this build though was that the lightweight install profile and the Drush Make file we used in development also let us quickly build two more sites for Results for Development that will launch in the coming weeks (the blog, book, events, user profiles, and contact form features are identical). This approach also helped keep the build tight, and it increased efficiencies for the organization’s other programs.
As I mentioned above, CHMI will be experimenting over the coming months with their data model and making adjustments to the data as more content is added. Anyone can submit programs through their “pipeline” feature, so if you’re involved in the field and have anything to add, check it out. We helped them put together this welcome video that will help you get started.
What we're doing.
Latest