
Building Drupal Powered Data Browsers: Stories from Data.WorldBank.org
- Estimated
- 8 min read
The Data.WorldBank.org project we built for the World Bank makes 339 human development data indicators open and available to the public (with 700+ more coming soon), but the site itself is really just a display layer on top of the World Bank’s API. In this post I’ll talk about our team’s key take aways from building Data.WorldBank.org, as well as the technology we used. A site like this is a bit different than most — it’s much more common for a site to display the same data it manages and not data from somewhere else — so we had to do things a bit differently.
API performance
When we started to build Data.WorldBank.org, the World Bank already had a public API thanks to the great work of Phase2 Technology and especially Irakli that exposed a subset of the data they needed on the site. However, there were a number of concerns and limitations surrounding it. It wasn’t known how much of a load the API could support, and in its current form it had a limited number of users, and though some users like Google were very large, beyond them the API had very little constant usage.
There were a set of changes that we knew would need to happen to the API for this project. The API application was already in the midst of being made multilingual. For this site we needed everything in the API available in four languages — English, Arabic, French, and Spanish. This required a substantial, though predictable, level of change to the API application and across the board changes to the public API methods. This is normal, particularly with this being the first time the World Bank was building off of its API. Also, with the amount of data being added to the API, no one knew what other changes would need to be made to keep the API application fast. Lastly, we didn’t want to disrupt the current user base with these potential issues and API changes.
Nearly all of the content and data on Data.WorldBank.org come from this API. While we had the option of accessing the API’s database directly, we decided early on that we needed to be consumers of the API, even if it meant running into issues and running a fork of the code base. In the end we had to do just that. In order to get the level performance we needed for the site (and with the number of indicators increasing by 300% for the April launch and the huge planned increase this summer), we had to change some of the API’s internals — some of these changes were reflected in the API’s methods and others meant that IDs had to be changed.
These changes prevented us from being able to offer this version publicly right away. However these changes will be slowly introduced into the public API. The process of building the site directly against the API provided valuable feedback of what needs to be changed in the public API. So while we settled on using a private copy of the API during the build, we think the process will help make public API stronger.
Building with Features
With all the data in Data.WorldBank.org being pulled from the API and very little information residing in the Drupal database, we were able to build the site as an install profile for most of the development cycle. This made for a highly streamlined build. We didn’t have a staging database until very late in the site build, when all the news and supplementary content was ready to be added to the site. Before then everything was captured as part of the site’s Features or as the install profile, including the Views that power listing pages and the Contexts that describe which blocks are visible on what pages.
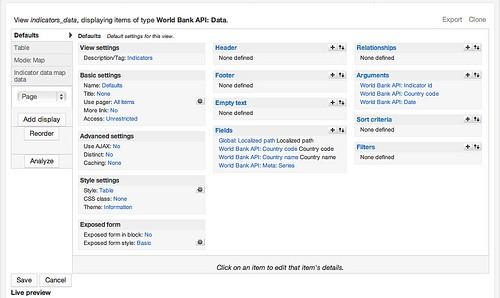
Views 3.x calls against the World Bank’s API
This was the first build where we used the new Views 3.x branch. Because the site is a showcase of what is possible with the API’s data, we wanted to leverage it directly. We wanted every display on the site to directly map back to API calls. While normally Views will only generate SQL and run it against a database, with Views 3.x it’s possible to change this behavior by providing a custom query object. So we wrote a plugin that enabled views to make REST calls against the World Bank’s API. What was truly exciting about this was that we were able to sustain the pace of building that Views enables while using a completely foreign data source.
Last year I wrote a blog post about using Views to query Flickr, and while the contents of that demo and Data.WorldBank.org are quite different, this project is structured a lot like that proof of concept. In both there is a small module that handles the specifics of making a call against a REST endpoint and provides per-request caching. Each has a Views query plugin that maps elements of views to the request forms and the response items back to Views fields. Looking forward we see some patterns and similarities in the caching strategies and the kinds of views field objects need for both Flickr and the World Bank’s API. I’m hopeful about the possibilities of generalizing what we’ve learned here and exploring leveraging standards like OpenSearch and SPARQL.
While the “extender” module I wrote was simply a proof-of-concept, the module we’re using here we hope has a much longer life. The World Bank API module is committed to Drupal.org cvs and is available for anyone to use to query the World Bank’s data.
With so much moving right now with the API, we expect to do a lot of new work on this module in the coming days. For now, this should be considered a developers’ preview, though that will be changing soon.
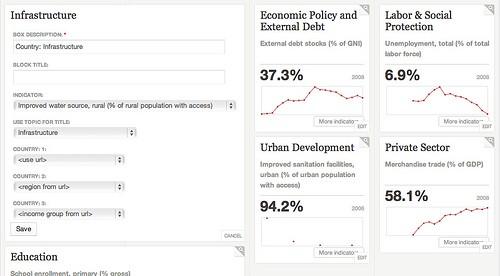
Boxes as windows into the API
In line with building Data.WorldBank.org as a display layer on top of an existing API, we wanted to use a set of widgets that could exist on their own on other sites. We created a small set of widgets with very simple configurations that could be assembled together to provide all the pages we needed. Each widget corresponds to a single API call or occasionally to a small set of them. With the widget design, our goal was to build them as if we were anonymous consumers of the API in that a single widget would only be able to make a limited set of calls against the API and wouldn’t be able to do much post processing. This approach validated to us the usefulness of the API. It makes it very clear about what data is available in the API and validated that even these simple and direct API calls could produce a very useful output.
These widgets were Boxes module powered blocks that, by using Context UI, we were able to simply drag into place on the site. A recent and very exciting change to the Boxes module allows for pluggable box types. When we think of blocks in Drupal, we generally think of a chunk of text that get formatted and displayed. Technically this formatting is done via the format system and check_markup(). Using Boxes makes these assumptions pluggable, module authors can capture input other than just a block of text, and render that input using functions other than check_markup(). If you've used the latest version of Managing News, you've seen this in action already. Custom boxes plugins in Managing News let users pick a feed from which contents will be shown and select whether they'll be displayed on a map, in a list, or as a graph. This site is built in the same way. We made a small set of custom box plugins that could quickly and easily be configured to show the specific indicator, as needed.
Graphs and Maps
Showing data in a list or table can be hard to interpret, and the data visualization on Data.WorldBank.org are very important. The graphs are all powered by the very excellent jQuery based Flot javascript library, and the Flot module. Flot is one of those projects that we love a little bit more each time we use it. It has become an indispensable graphing library for nearly all our data driven sites.
Alongside the graphs on Data.WorldBank.org are maps, powered by Openlayers and the Openlayers module. The maps were generated by our MapBox stack, using a custom tile set that’s based on the World bank’s own GIS data and labels that our cartographer AJ refactored and designed. The most exciting part for us about these maps is that they’ve been translated. Each language — English, Spanish, French and Arabic — has its own completely localized tileset.
Conclusion
Data.WorldBank.org is a great example of how it is possible to quickly build sites that leverage remote data sources but are built with normal Drupal tools. A lot will be moving in the next couple of weeks with the site, the public API, and the World Bank API module. We will post soon with more details about the updates we’re making to the World Bank’s API itself and about how the API module is meant to be used. Also, expect a Google Group to be set up for World Bank API users later today.
What we're doing.
Latest