
Improving Water Quality Management with Satellite Data
- Client
- With EDP Labelec and Mare Center
The Water Health Indicator Service (WHIS) helps Labelec to better understand the reservoirs they monitor.

Overview
The Water Health Indicator Service (WHIS) provides a continuous data stream of water health indicators for inland water bodies. Water quality indicators are calibrated with in-situ data from our partners and include physical characteristics such as water extent, turbidity, and chlorophyll content. The data can be used to improve water quality monitoring practices.
Challenge
Water quality measurements are still often obtained from in situ data collection. While in situ data collection is highly accurate and often required by law, it is updated only every few months and limited to individual point locations. The satellite-derived data produced for WHIS can potentially overcome these limitations by complementing in situ data.
Outcome
This project has enabled Labelec to better understand the dynamics of water quality in the reservoirs they monitor. They now have a clearer understanding of the strength and limitations of satellite-derived water quality data. Using an intuitive web interface, Labelec can access an archive of water quality data indicators that our, leading to better and more efficient management practices.
A Better Water Data Pipeline
In this project, we aimed to produce the most impactful and scientifically rigorous water health indicators possible via remote sensing. We partnered with EDP Labelec as the foundational user and Mare Center as our scientific partner. It has been invaluable to work with Labelec to understand how a water quality monitoring system should look. They also shared their historic in-situ measurement data, providing us with a unique dataset we leveraged for indicator calibration.
Image Pre-Processing
Mare Center supported the scientific development of water health indicators. Using satellite imagery over water is complex, requiring a crucial pre-treatment step: atmospheric correction. While this process is also used for land, it demands different algorithms for water. Thanks to their expertise, we were able to select the best atmospheric correction algorithms with the right configurations.
Based on their expert feedback, we preprocessed the entire Sentinel-2 archive with two atmospheric processors specialized for water applications: C2RCC and Acolite. For each of these, we performed a date match-up with the in-situ data provided by Labelec and extracted data to correlate with the satellite-derived indicators. While we are satisfied with the resulting correlations, a range of improvements could still be made to increase the reliability of the indicators.
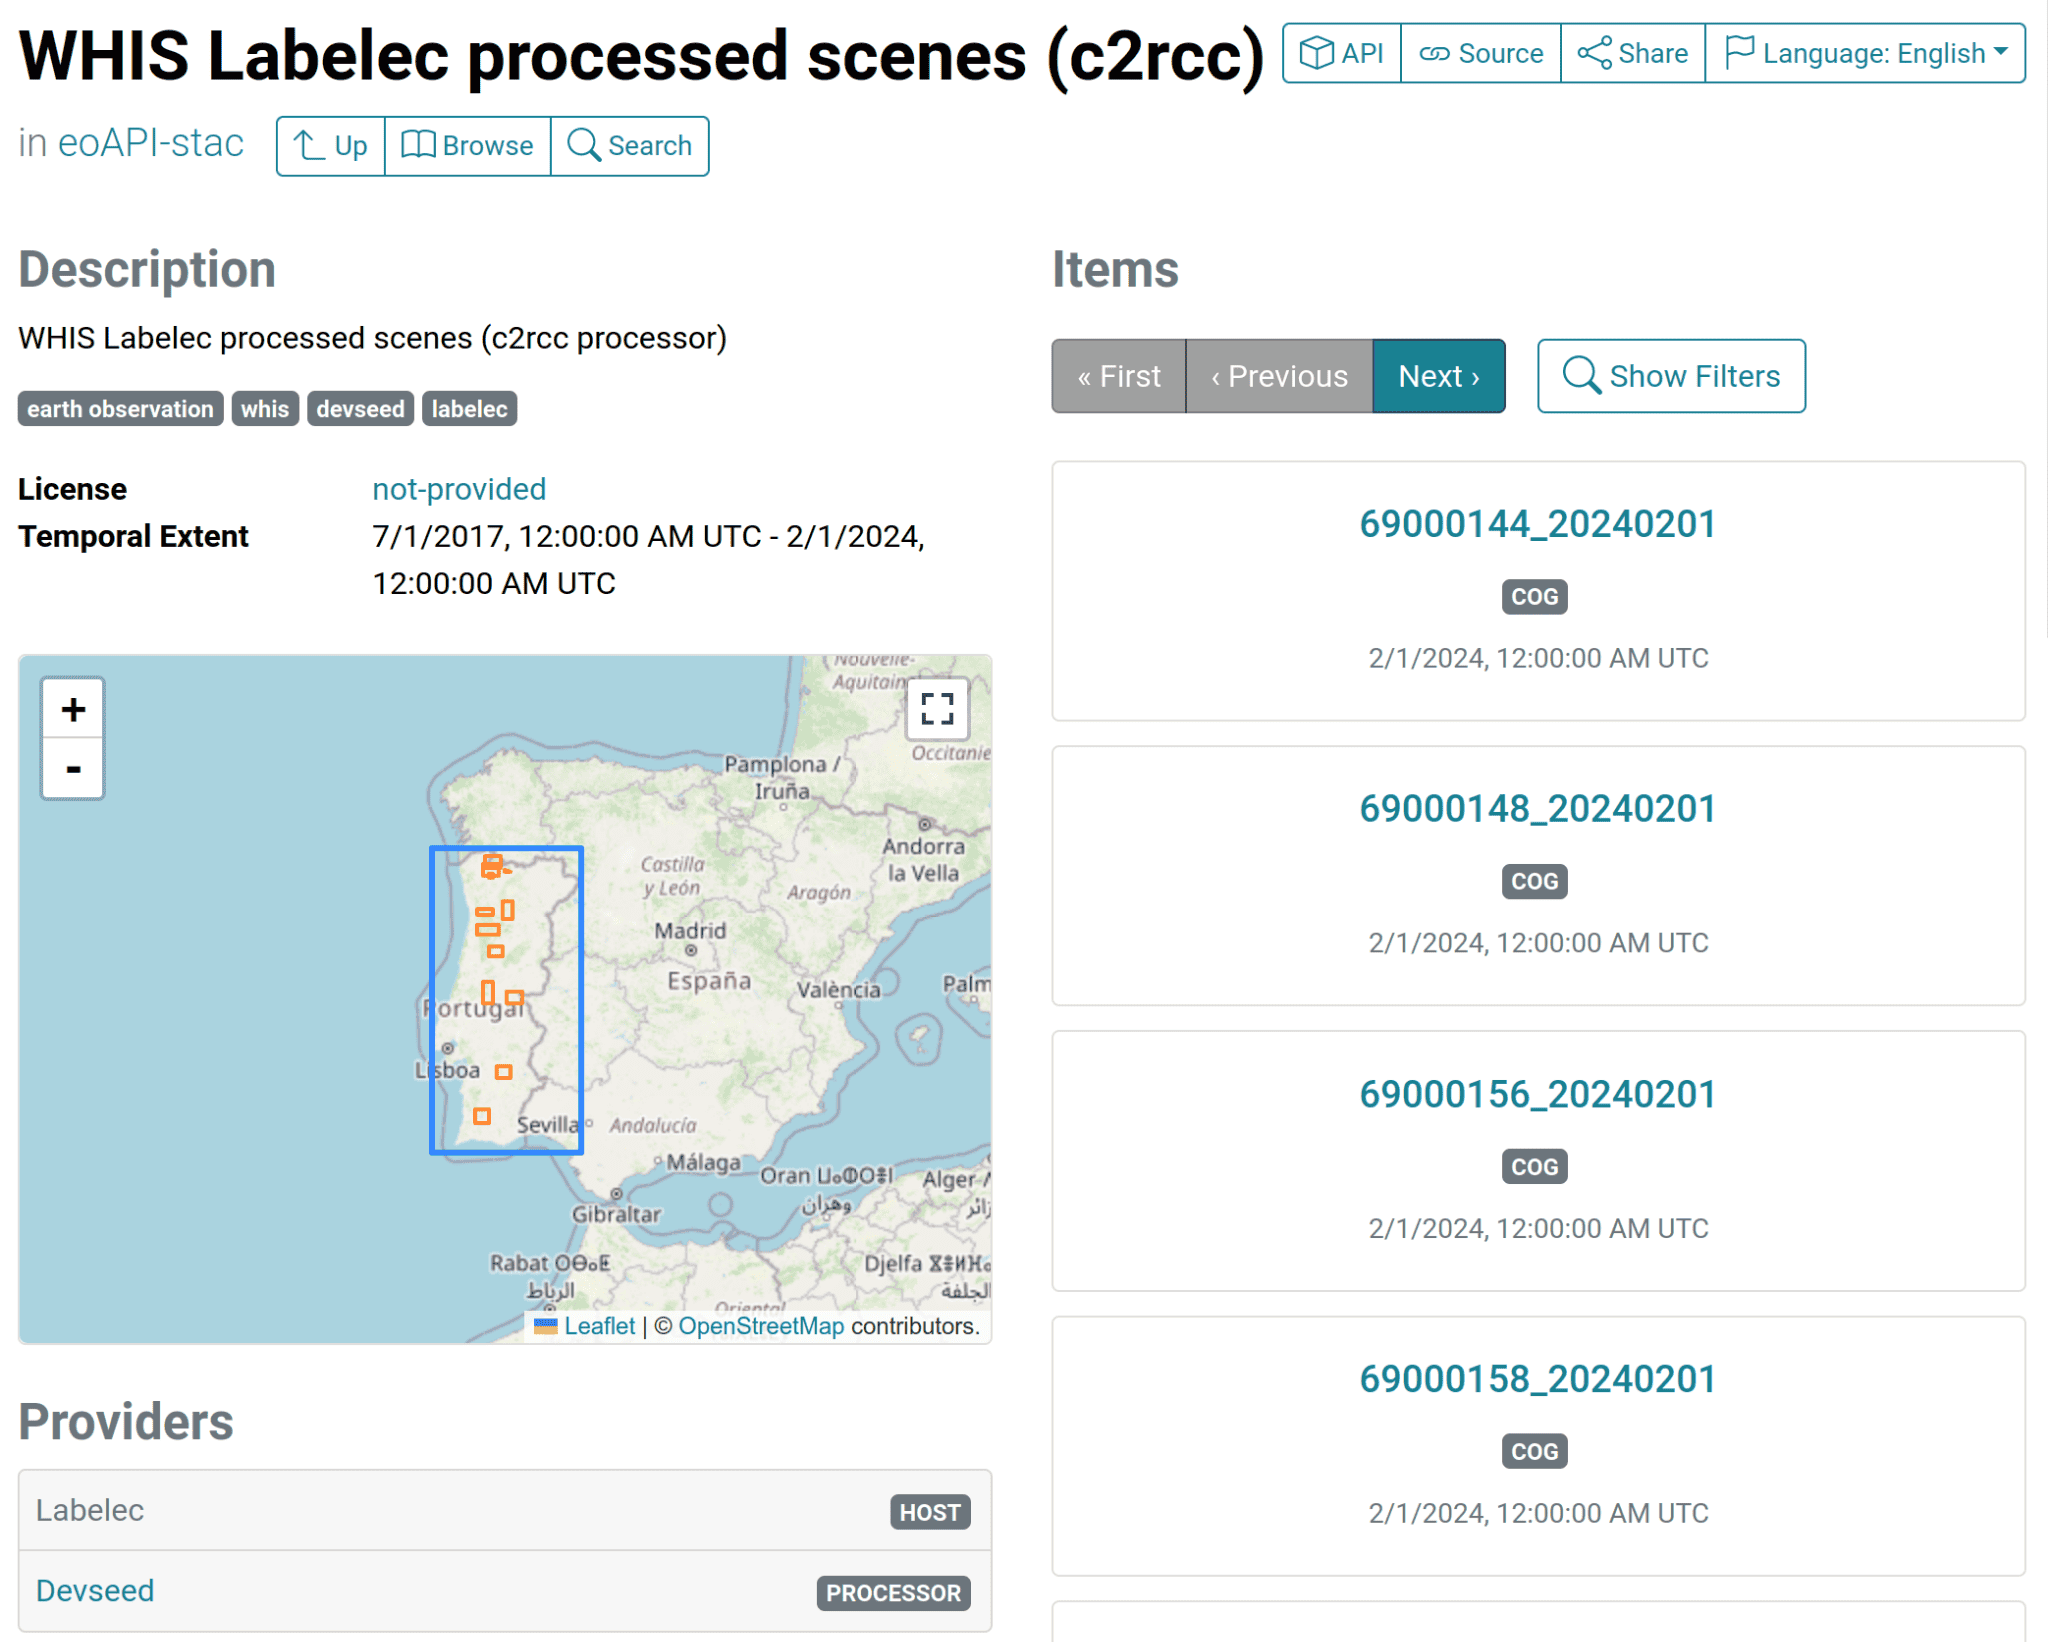
Screenshot of the STAC browser of the WHIS imagery catalog
Interface design
After the data was processed we developed an intuitive and easy to use web application to display the results. An interface is essential for users to extract value from the data catalog.
We opted to have a map-centric approach for interactive exploration. The user can navigate to the water body they want by either picking a water body from the map or using the cards at the bottom. For these cards we took advantage of the Mapbox Image API which allows us to get a snapshot of the map at a certain location and zoom level. This way we can show the user a preview of the water body and its surroundings.
Demo video of WHIS. Shows the selection of a water body and exploration of associated indicators.
Single location
When exploring a single water body we leveraged Mapbox's elevation data to show the surrounding terrain and the water body itself. This way the user can get a better understanding of the location and the water body they are looking at, which makes for a more immersive view especially in the mountainous regions.
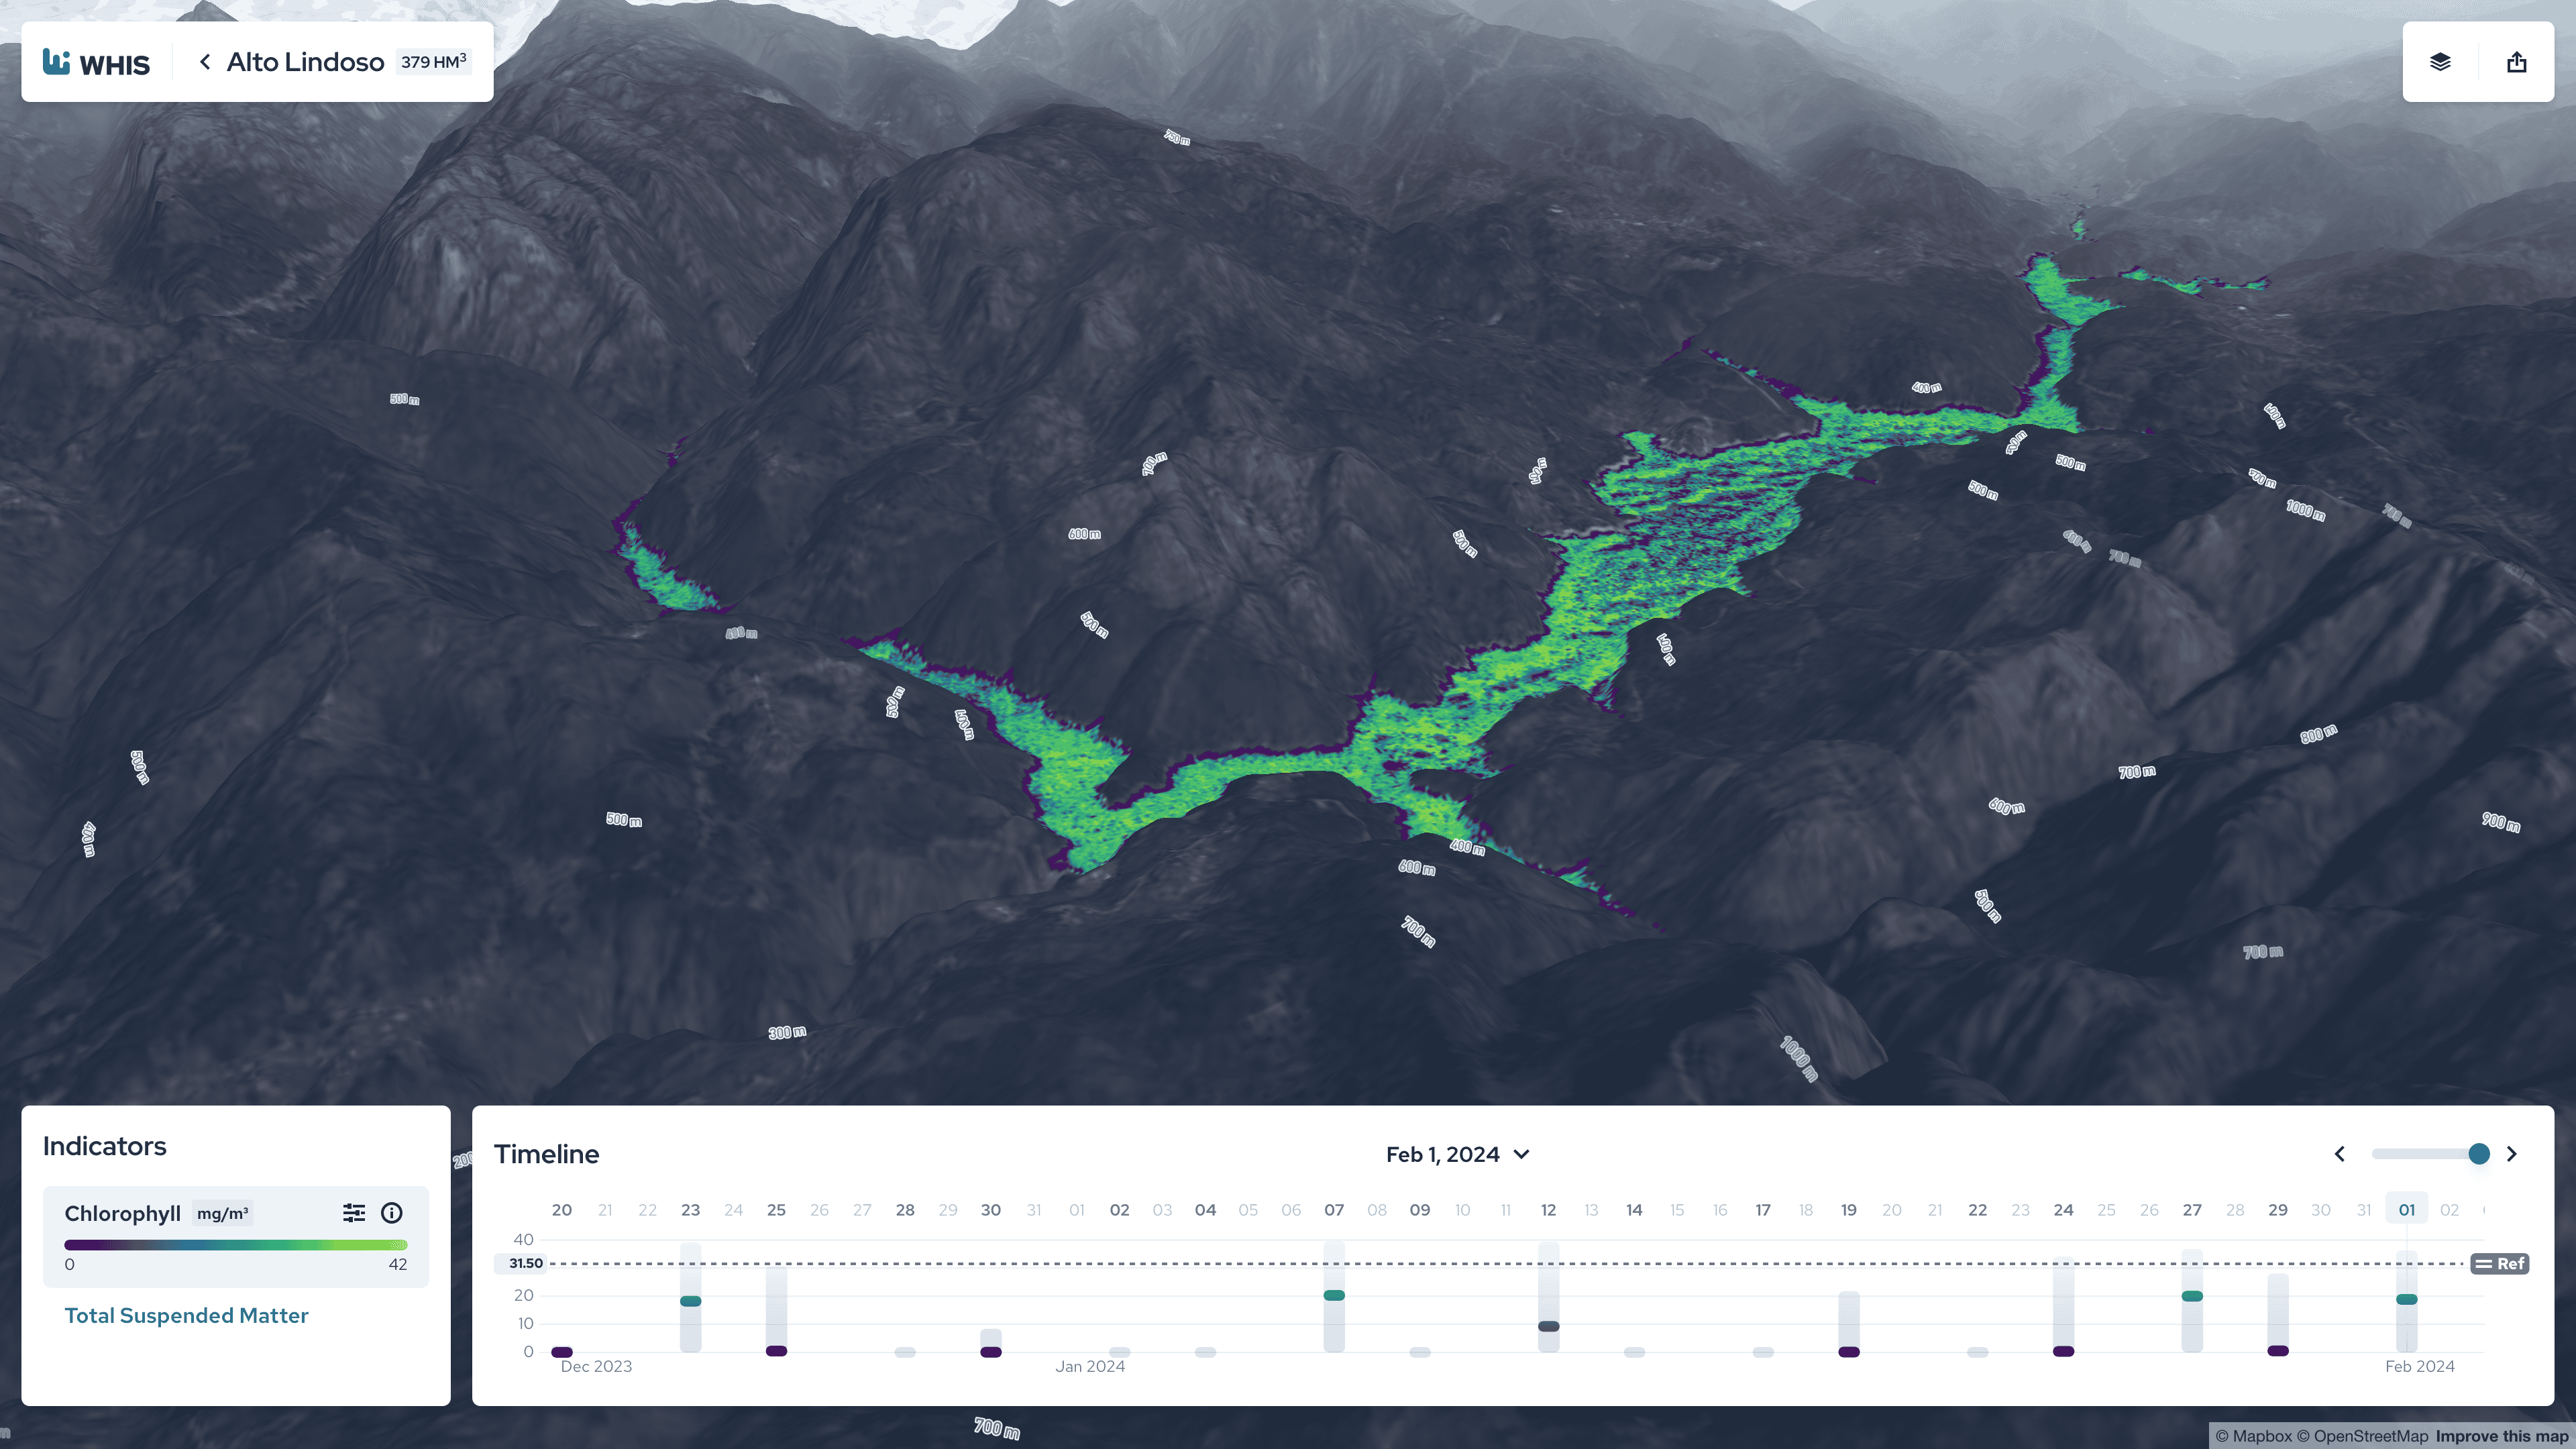
Screenshot of 3D perspective on Alto Lindoso.
The timeline displays the available dates to browse which depend on the satellite revisit period (how often the satellite passes over a given area) but also whether it was possible to extract any data from the image, since some images are completely clouded.
The colored track associated with each day, gives a quick overview of the selected water quality indicator's value. The track itself shows the range of values for that day (min and max), with the thumb indicating the mean value. Hovering over the track will show a tooltip with the exact values.
Users can select a specific day to display the corresponding water quality data on the map. Additionally, and taking advantage of the tiler, users can adjust the colormap and rescale the data (allowing them to focus on a narrower range of values) to customize the visualization for their analysis needs.
Inspecting Custom Locations
A realistic use case for this sort of data is to be able to know the values of the water quality at an exact location. For example, if the concentration level of chlorophyll is above a certain threshold near a beach, it could mean that the water is not safe to swim in and the beach needs to be temporarily closed. Clicking on the map will display a pop-up with some information about the water quality at that location and its change relative to the previous period.
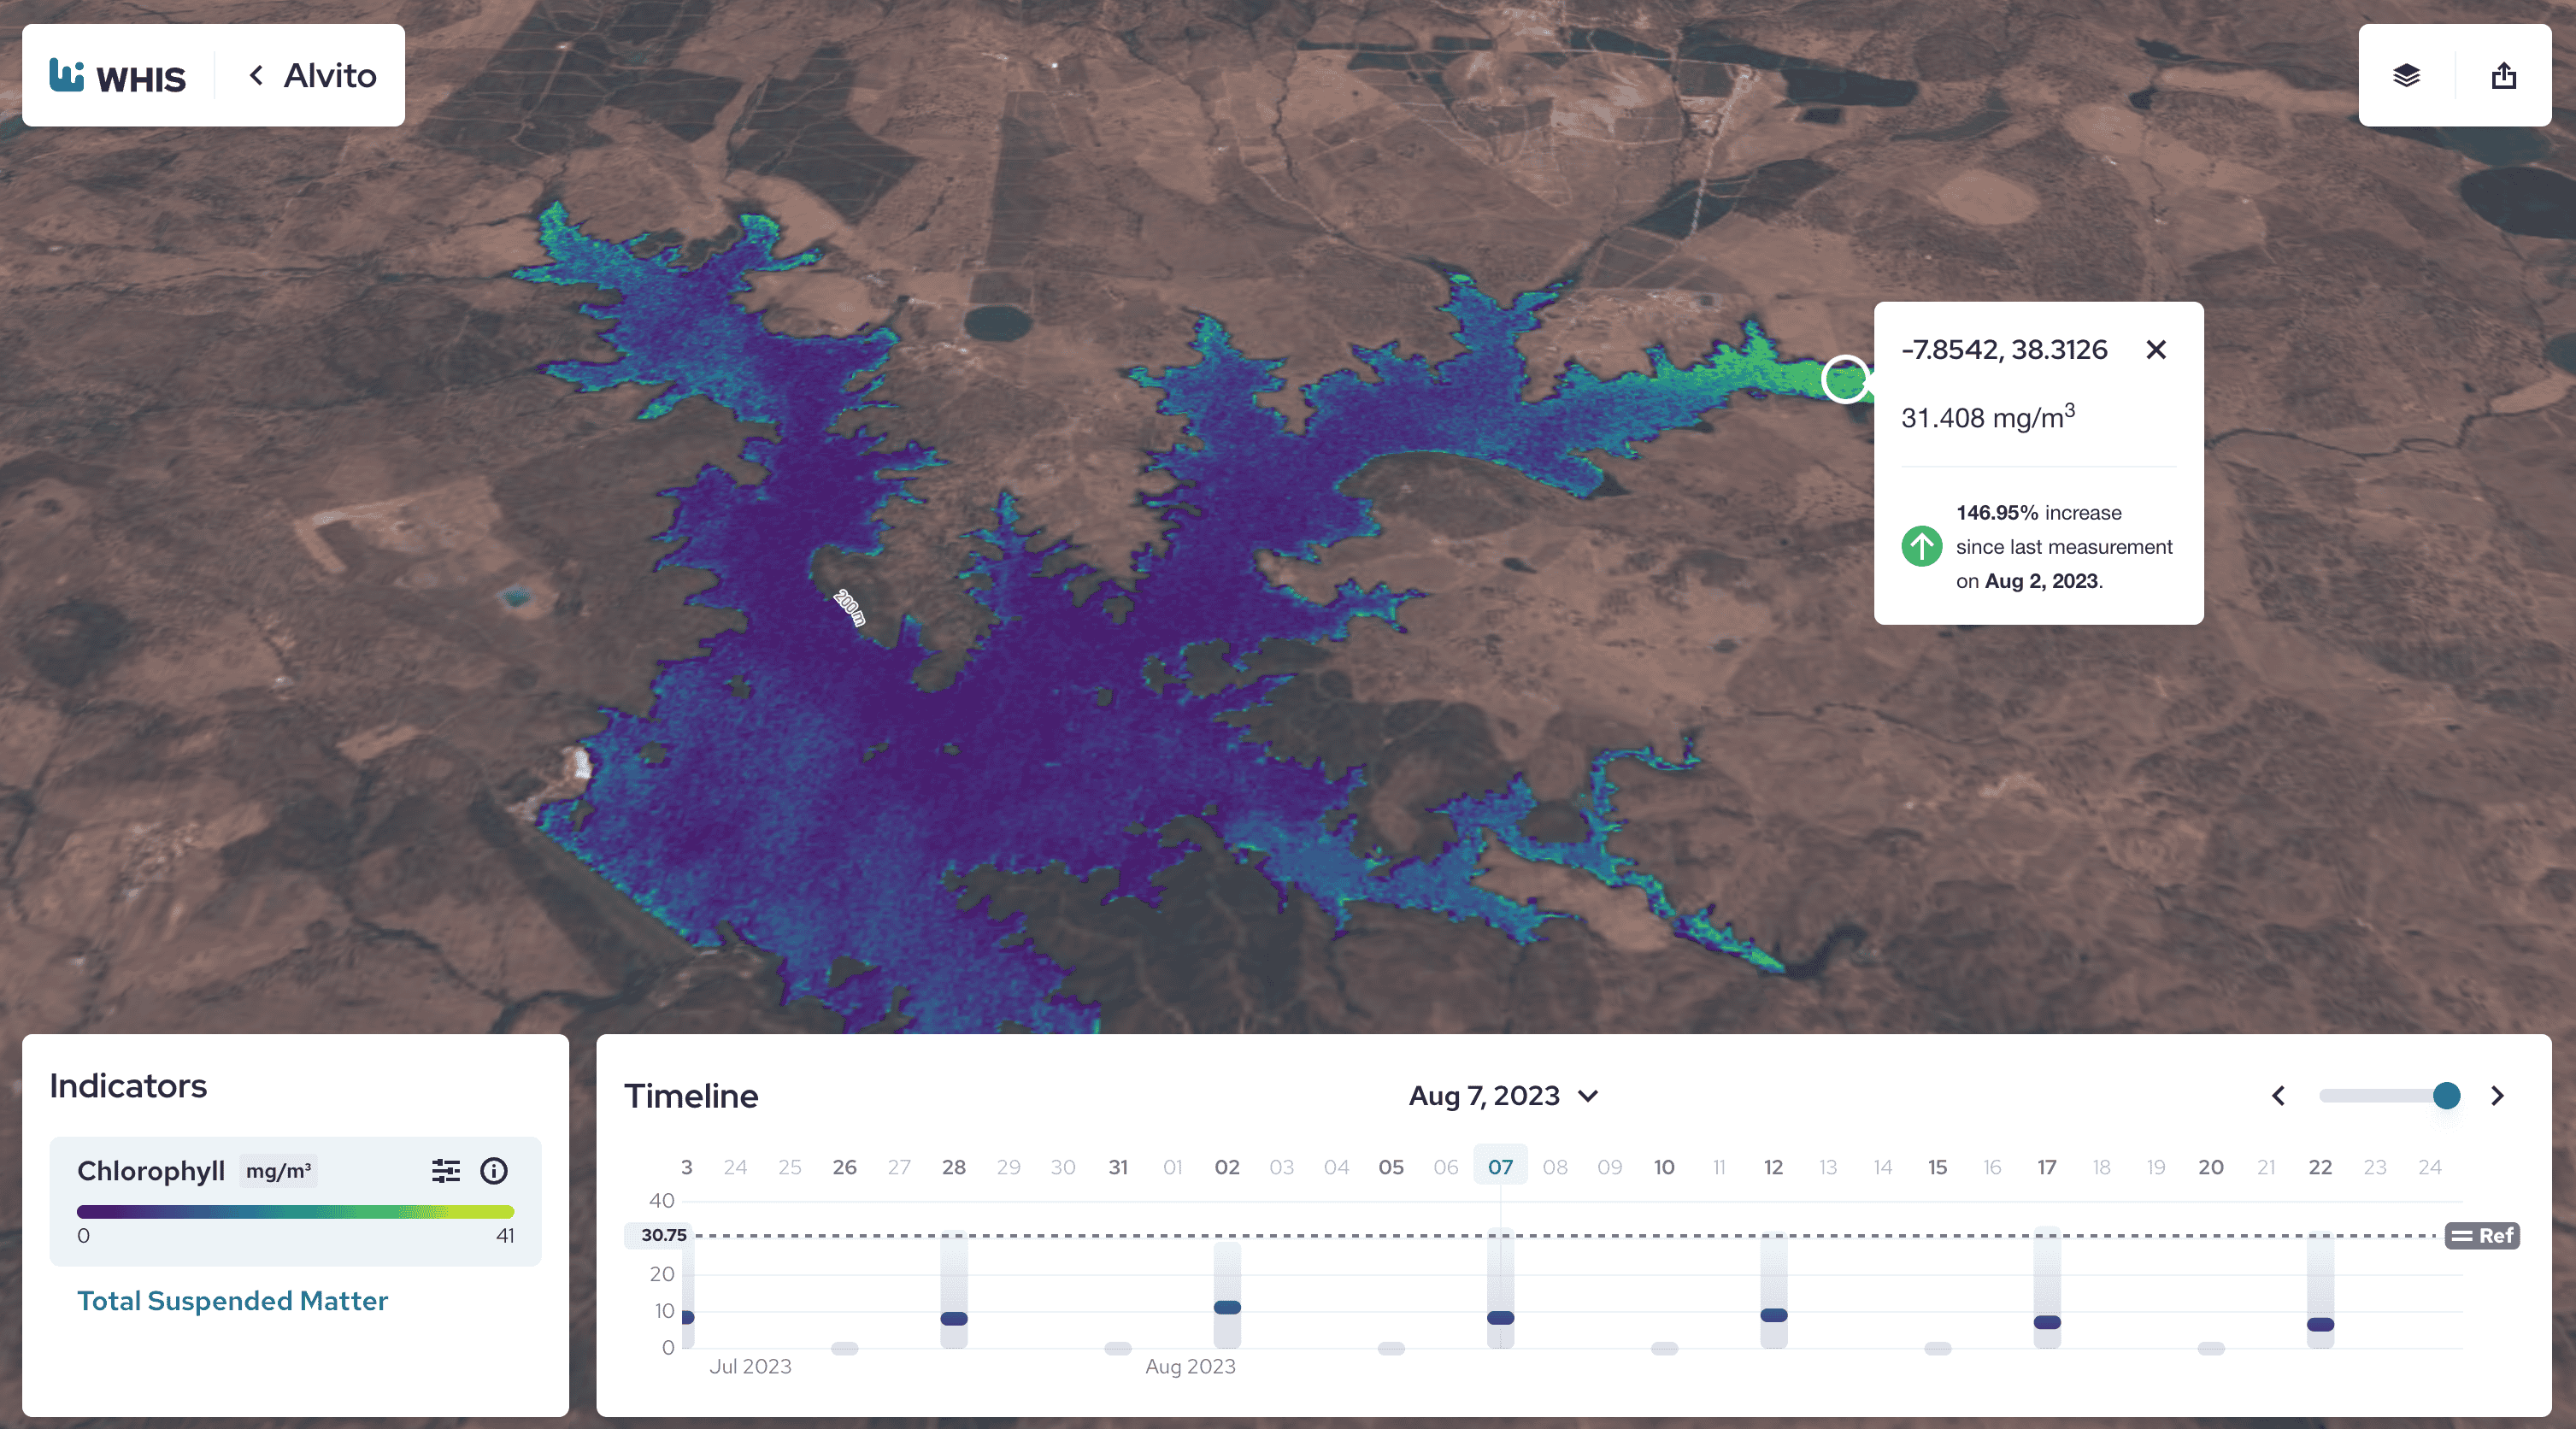
Screenshot of the inspector tool for an algae bloom in Alvito.
An Open Approach to Area Monitoring
For this partnership we developed an end-to-end solution for water health monitoring of inland water bodies. Labelec and Mare Center were fantastic partners that ensured we used scientifically rigorous algorithms and produced results that are useful in practice.
The work we developed here uses a generic approach that relies on general purpose standards like STAC and eoAPI. This project serves as a blueprint for area monitoring. Area monitoring is useful in many contexts, for instance in the European Common Agriculture Policy or the Regulation on Deforestation-free Products, and more generally for building report dashboards. We are going to continue pursuing our approach to this topic using open standards and user focused interfaces.
We'd love to chat if this resonates with a need you have.
Related content
More for you
Have a challenging project that could use our help?
Let's connect
We'd love to hear from you.