
Visualizing Global Emissions Data to Drive Climate Action
- Client
- With Rocky Mountain Institute (RMI)
The Oil Climate Index Plus Gas (OCI+) by the Rocky Mountain Institute makes global emissions data accessible and actionable.

Overview
OCI+ enhances global climate change initiatives by quantifying and comparing greenhouse gas emissions from global oil and gas assets using advanced data visualization. Its interactive and user-friendly design enables more informed and effective climate action.
Challenge
Emissions data is difficult to understand. It's often hidden from view, it's constantly changing, and there is simply too much data to make sense of. If you don't understand the emissions, it becomes even harder to do anything about it.
Outcome
OCI+ has increased transparency in the fossil fuel industry. Bringing oil & gas companies to the table with environmental stakeholders and policy makers to reduce emissions. Now, all stakeholders can easily understand these huge datasets and are taking action.
Transforming Data into Understanding
RMI has been a long-term partner of ours, seeking to advance our collective climate change response by tracking global fossil fuel emissions. The Oil Climate Index Plus Gas (OCI+) is one part of this broader effort. OCI+ quantifies and compares greenhouse gas emissions intensities from global oil and gas assets. Its goal is to allow users to see where GHGs are emitted. It also investigates reducing life-cycle emissions from production, refining, and petrochemical processing, gathering, storage, transport, and end uses.
This data is multifaceted and complex, making it very difficult to work with and understand for people who don’t use it daily. This poses a major roadblock to their mission. As anybody who works with data knows, how you communicate the data is just as important as the actual data itself. In this case, if their target audience cannot gain insights from RMI's collected data, they will have difficulty making meaningful changes. RMI has become expert at explaining data in ways people can understand. The only challenge was visualizing that data in a web browser to make their impact truly scalable.
Interactive Exploration
Our team has many years of experience visualizing complex datasets. Working side-by-side with RMI, we devised a simple yet effective visualization of their global Oil & Gas emissions data. One of the key elements of this visualization is that users can interact with it. Interacting with the data at hand engages a part of the brain that ensures increased understanding and continued engagement. Instead of quickly looking over some chart or figure, users can explore the data themselves, find what is relevant or interesting to them, and then download the raw data for further exploration. Users would struggle to understand and navigate this complex dataset without engaging with the data. This engagement element is key to everything and showcases the power of cloud-hosted, web-based dataset exploration.
We also collaboratively designed a workflow that fits RMI's existing workflows and capabilities. This workflow enables the type of user interactions important to these tools. This has allowed the data to be easily updated because the only thing worse than poor data visualization is when you realize the data isn’t current.
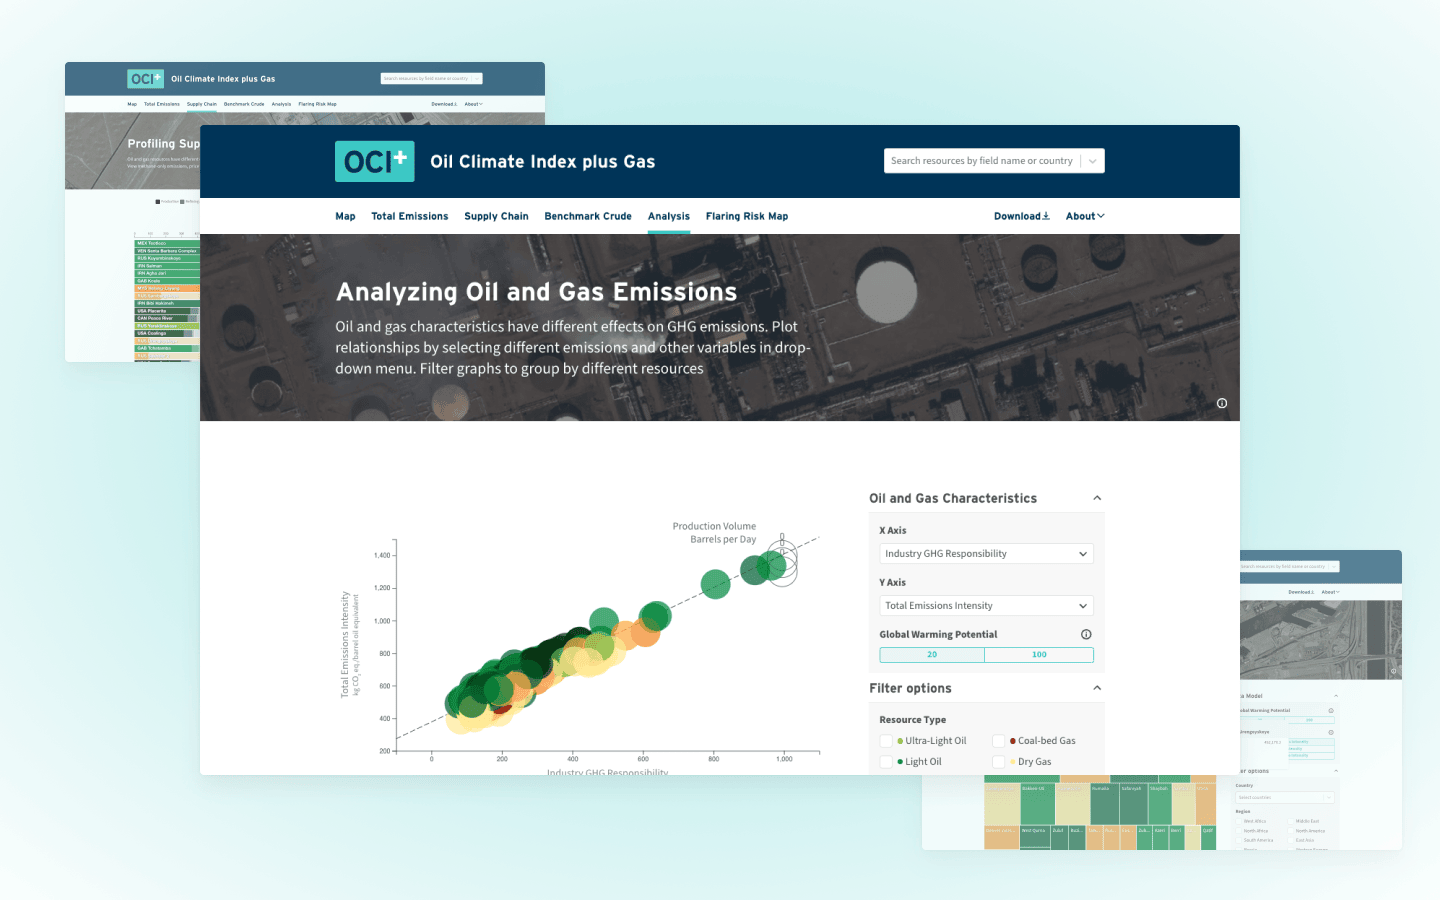
Examples of the interactive visualizations you can find in OCI+.
Advancing Data-Driven Climate Solutions Together
This close collaboration with RMI has been critical to this project's success. By fostering a positive working relationship, the best ideas can come forward, and new features can be developed quickly. Transparency and teamwork are hallmarks of this project. This allows the product to evolve to meet shifting needs as we find a product-market fit that effectively supports RMI’s goals. When you work with such a fantastic partner as RMI, their goals are really important to everybody. This is why Development Seed places so much value on building relationships and working collaboratively. When our partners succeed, we all succeed.
As we continue to push the technological frontier on how to visualize complex datasets, we are learning more and more about how powerful these simple, engaging data visualizations can be for organizations like RMI. Better use of web-based visualizations can scale an organization’s impact and achieve its goals. We are excited about OCI+'s direction and ability to apply what we learn here to other projects. This supports our mission that every decision that could positively impact the planet is made with the best available data about the planet.
Have a challenging project that could use our help?
Let's connect
We'd love to hear from you.