
LEGO Mosaic from Sentinel-2: A Hands-On Earth Observation Installation
- Client
- With Copernicus Data Space Ecosystem
We used openEO by TiTiler to transform Sentinel-2 imagery into a collaborative LEGO mosaic at ESA’s Living Planet Symposium 2025.

Overview
We collaborated with the Copernicus Data Space Ecosystem to create a physical LEGO mosaic from Sentinel-2 satellite imagery, transforming Earth observation data into a tangible and collaborative installation. Using openEO by TiTiler, we processed and visualized data from the Copernicus archive into color-enhanced tiles that attendees at ESA’s Living Planet Symposium 2025 assembled in real time.
Challenge
Satellite imagery is inherently abstract and often inaccessible to non-experts. Our challenge was to make Earth observation data physically tangible and interactive by converting satellite imagery into a collaborative LEGO build. The solution involved designing an efficient, visually meaningful, and technically robust pipeline for processing, styling, and translating pixels into LEGO-compatible color blocks.
Outcome
The result was a 1×1 meter LEGO mosaic of Europe, built by conference attendees from over 11,000 bricks. Each of the 650+ tiles was derived from real Sentinel-2 imagery, processed via openEO by TiTiler. The installation bridged the digital and physical worlds—turning cloud-native geospatial data into a shared hands-on experience.
Our workflow for the installation at the ESA Living Planet Symposium 2025 leverages the openEO API specification implemented through TiTiler, enabling real-time, on-demand processing of Earth observation data. Each step is both technically robust and accessible to conference attendees who will physically build the final mosaic.
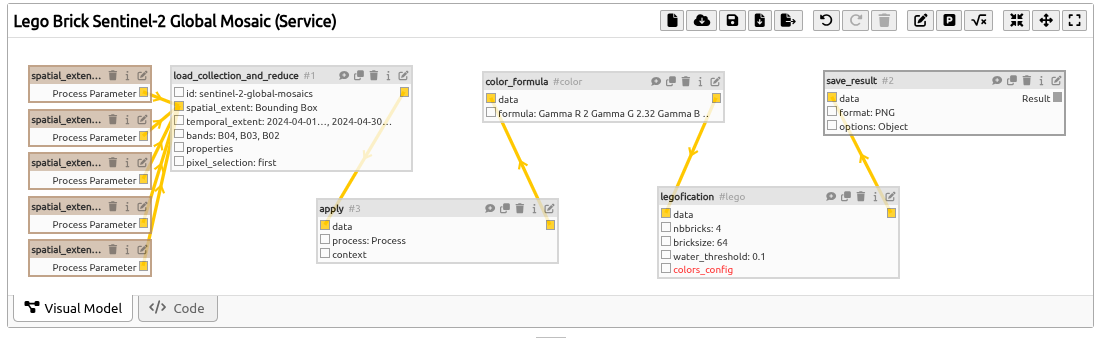
Screenshot of the openEO by TiTiler graph for the LEGO Brick Sentinel-2 Global Mosaic Service, showcasing the entire processing pipeline from data acquisition to final visualization.
Step 1: Data Acquisition via CDSE STAC API
Sentinel-2 Mosaic Retrieval
First, the Copernicus Data Space Ecosystem (CDSE) STAC API is queried for Sentinel-2 global mosaics. These quarterly mosaics provide cloud-free, analysis-ready data covering our target region of Europe. We chose Spring 2024 data for its vibrant colors and the remaining snow cover in the Alps and in Scandinavia. This adds visual interest to the mosaic.
# openEO process graph for data loading
"load": {
    "process_id": "load_collection_and_reduce",
    "arguments": {
        "bands": ["B04", "B03", "B02"],  # Red, Green, Blue
        "id": "sentinel-2-global-mosaics",
        "spatial_extent": {
            "east": 45.0,
            "north": 71.0,
            "south": 30.0,
            "west": -25.0,
            "crs": "EPSG:4326"
        },
        "temporal_extent": ["2024-04-01T00:00:00Z", "2024-04-30T23:59:59Z"]
    }
}
Why STAC? The SpatioTemporal Asset Catalog (STAC) specification provides a standardized way to describe geospatial assets. The CDSE STAC API enables efficient discovery and access to petabytes of Copernicus data through simple HTTP requests.
Key Features:
- Millisecond Query Response: Powered by pgSTAC
- CQL2-JSON Filtering: Advanced spatial and temporal filtering capabilities
- Cloud-Optimized GeoTIFF: Direct access to optimized raster assets
Step 2: Color Enhancement for Visual Impact
Rio-Color Formula Application
Raw Sentinel-2 reflectance values (0-10,000) need transformation into visually appealing RGB colors. We apply a color enhancement formula using rio-color operations:
"color": {
"process_id": "color_formula",
"arguments": {
"data": {"from_node": "scale"},
"formula": "Gamma R 2 Gamma G 2.32 Gamma B 2.2 Sigmoidal RGB 10 0.237 Saturation 1.15"
}
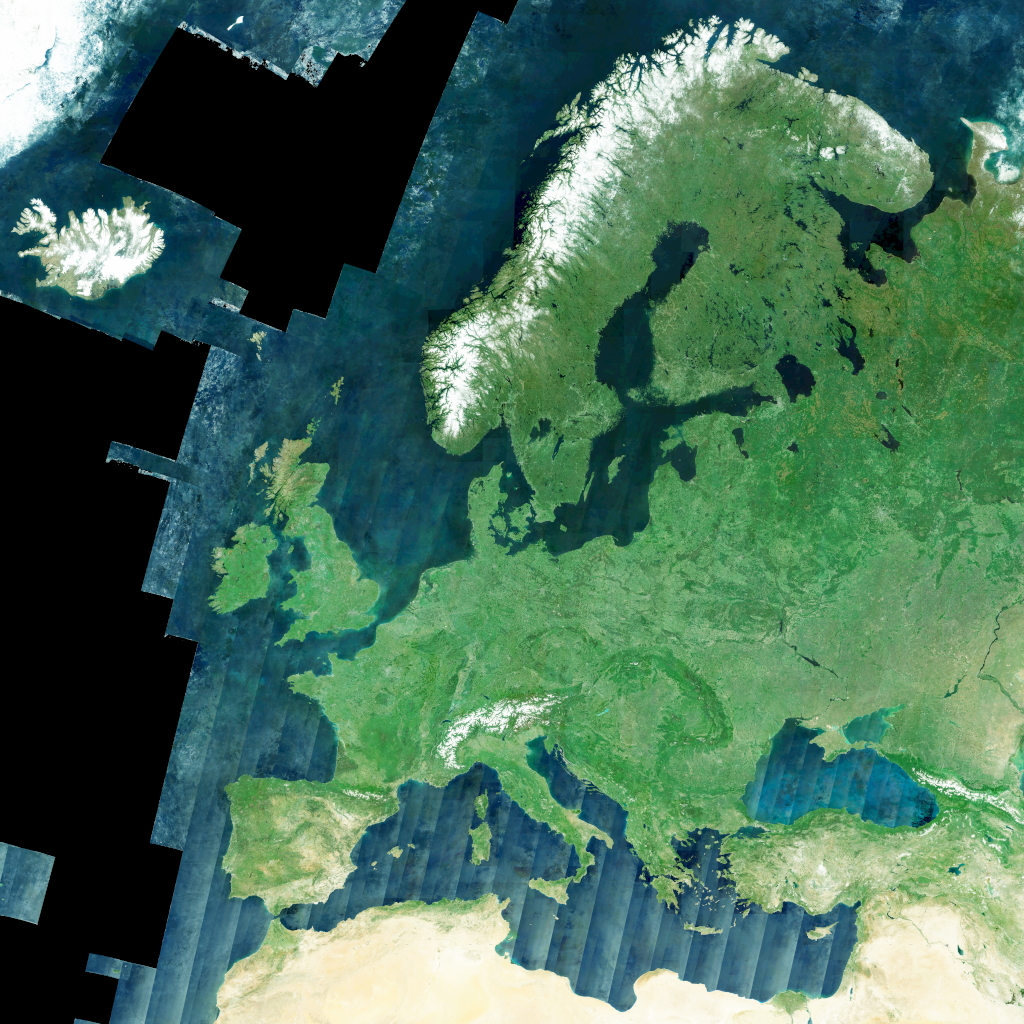
}This creates the vibrant, high-contrast imagery that forms the foundation of our LEGO mosaic.
Sentinel-2 global mosaic of Europe
This image is color-enhanced for legofication, transforming raw reflectance values into vivid RGB colors suitable for building with LEGO bricks.
Step 3: Translating Imagery into LEGO Bricks
The legofication process is the heart of our workflow, transforming continuous satellite imagery into discrete LEGO brick representations through three key stages:
Downscaling (Compression)
def _compress(img: ImageData, nbbricks: int = 16) -> ImageData:
    min_side = min(img.array.shape[-2:])
    new_shape = numpy.round(
        numpy.array(img.array.shape[-2:]) / min_side * nbbricks
    ).astype(int)
    return img.resize(new_shape[0], new_shape[1], resampling_method="bilinear")
Each 256×256 pixel tile is compressed to a smaller grid (typically 4×4 bricks), where each "pixel" represents one LEGO brick.
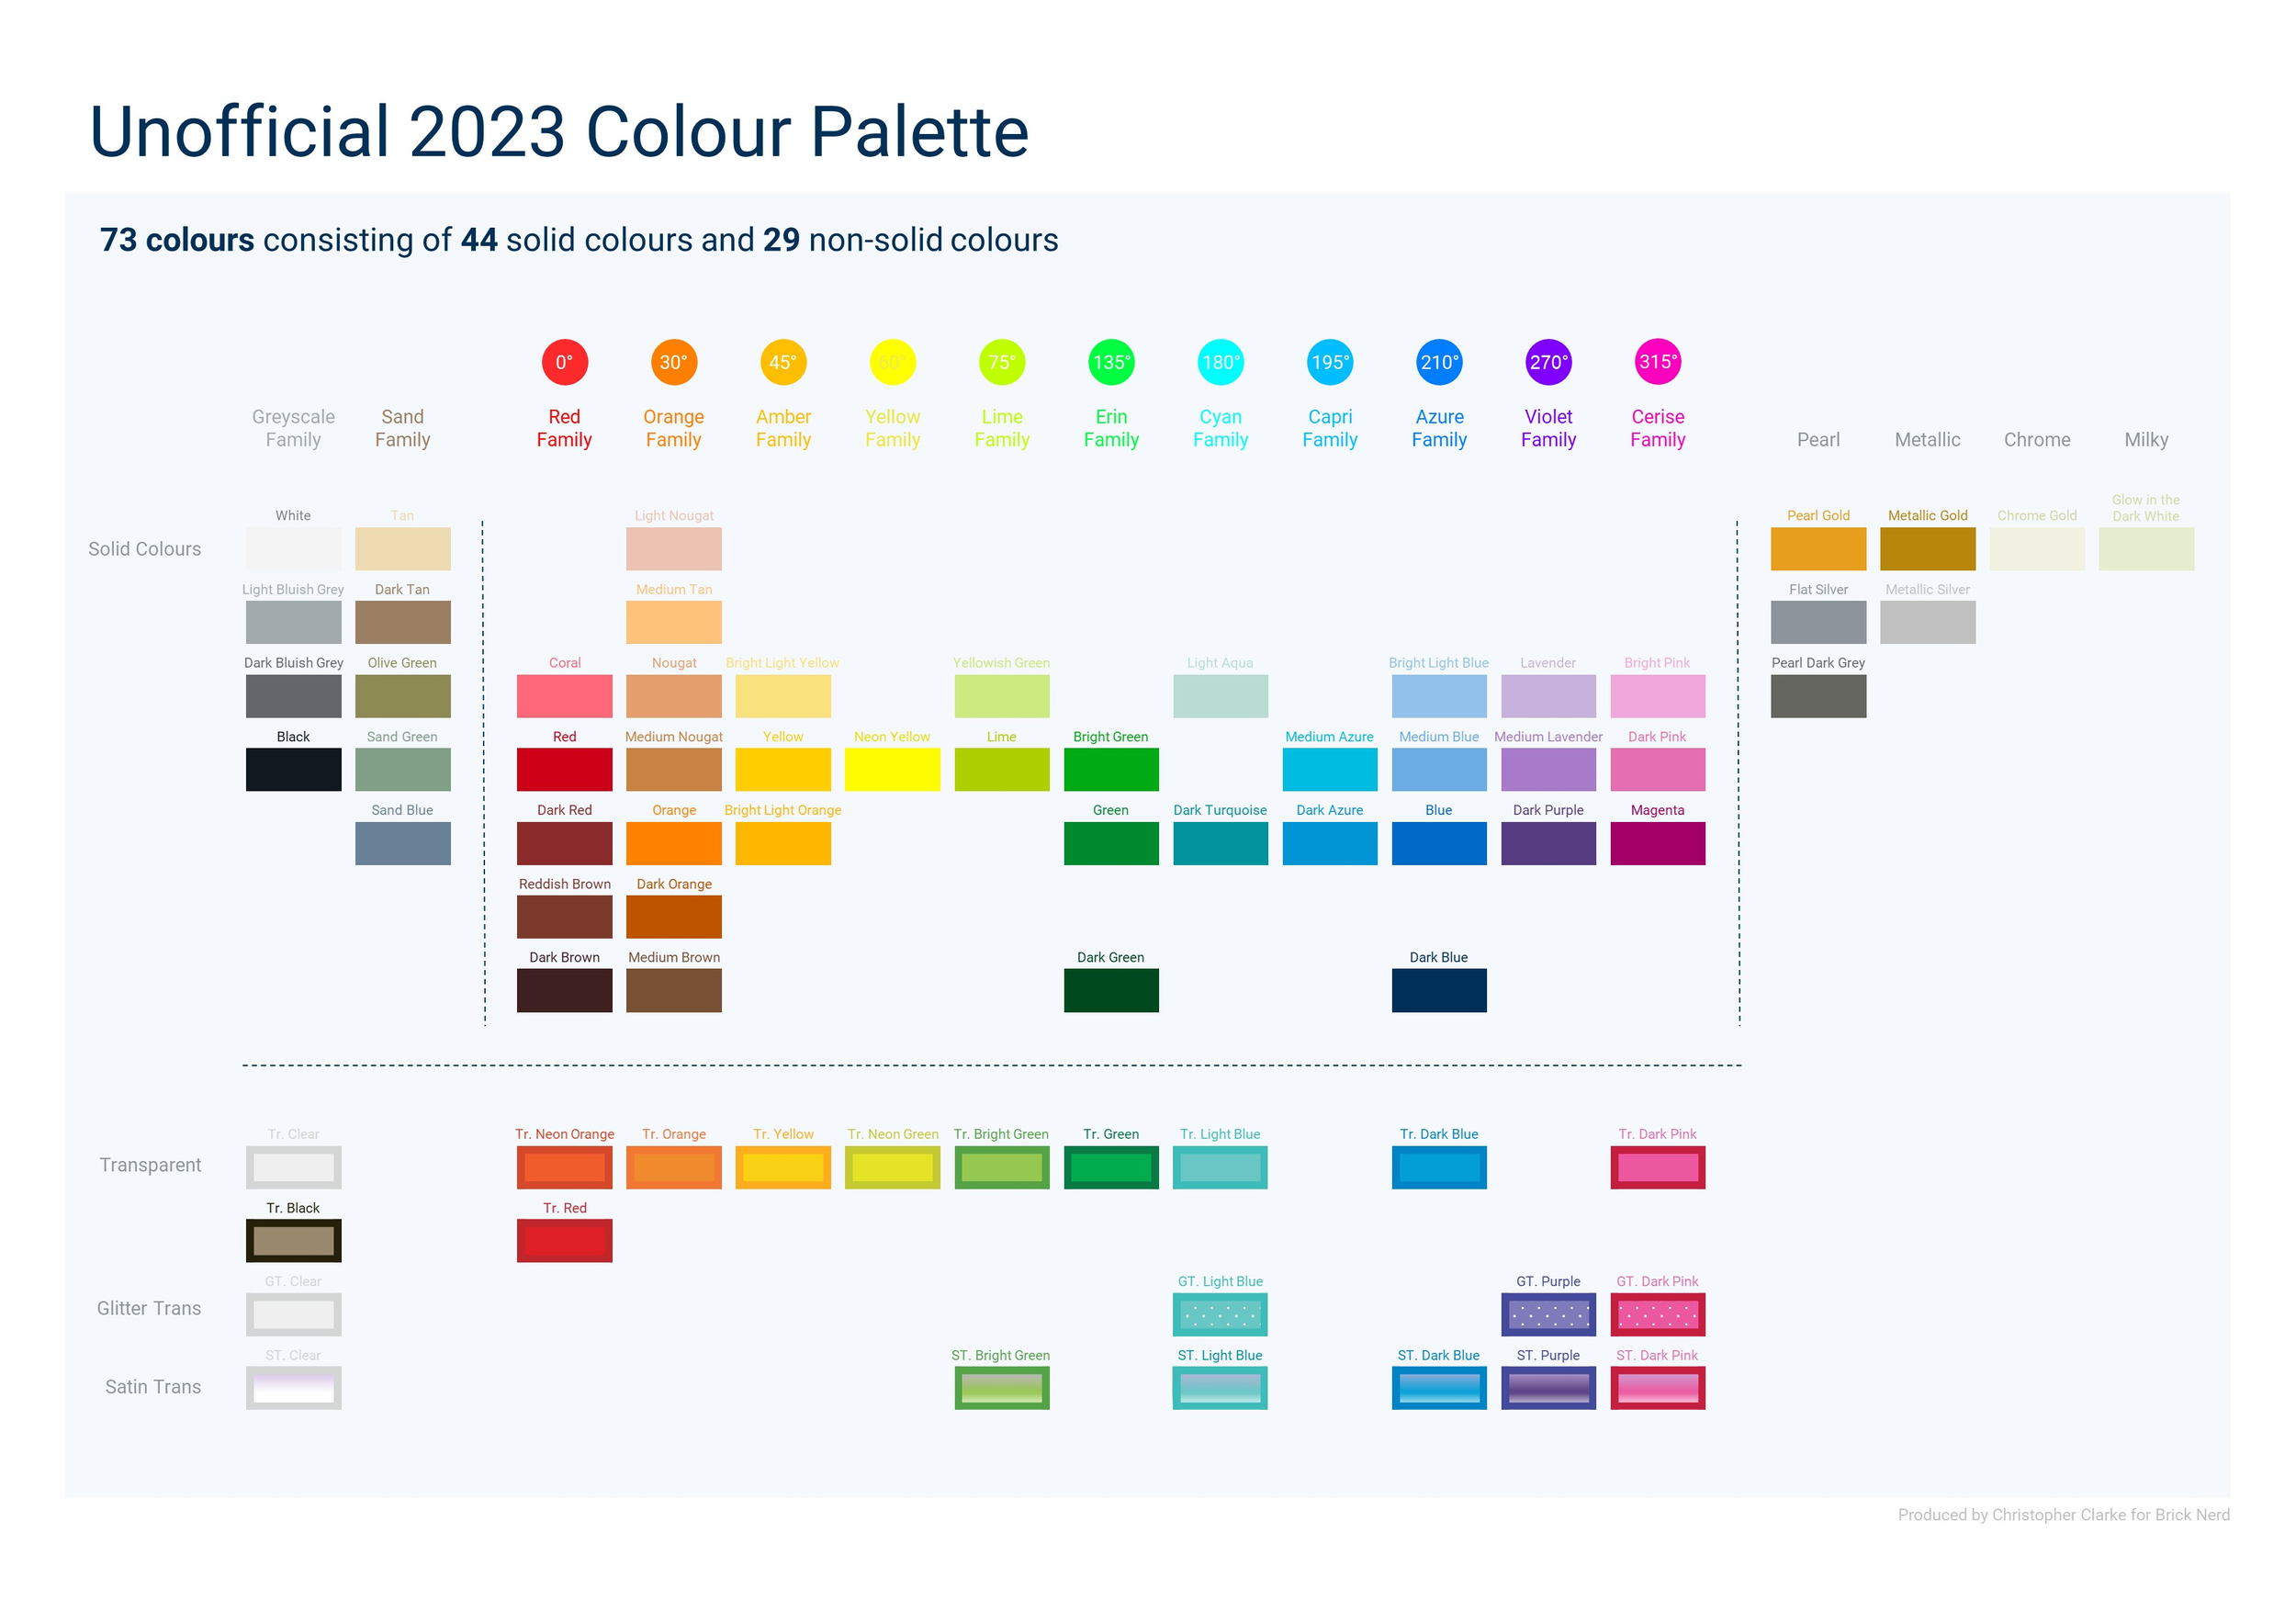
Color Quantization
The most sophisticated part involves mapping RGB colors to authentic LEGO brick colors using the CIEDE2000 color difference algorithm used in the textile industry. This ensures that each pixel's color is represented by the closest official LEGO color.
def find_best_lego_color(rgb: numpy.ndarray, use_transparent: bool = False) -> Tuple[str, numpy.ndarray]:
    # Convert RGB to Lab color space for perceptually uniform comparison
    rgb_normalized = rgb.astype(float) / 255.0
    lab_input = colour.XYZ_to_Lab(colour.sRGB_to_XYZ(rgb_normalized))

    min_distance = float("inf")
    best_color = None

    # Find closest LEGO color using CIEDE2000 color difference
    for color_name, color_info in lego_colors.items():
        rgb_lego = numpy.array(color_info["rgb"], dtype=float) / 255.0
        lab_lego = colour.XYZ_to_Lab(colour.sRGB_to_XYZ(rgb_lego))
        distance = colour.delta_E(lab_input, lab_lego, method="CIE 2000")

        if distance < min_distance:
            min_distance = distance
            best_color = color_name

    return (best_color, lego_colors[best_color]["rgb"])
Color Science Details:
- CIEDE2000: Industry-standard perceptual color difference metric
- Lab Color Space: Perceptually uniform color representation
- LEGO Palette: 60+ official LEGO colors mapped from Pantone specifications
- Water Detection: Uses EEA coastline data to identify water areas for transparent bricks
Upscaling and Brick Effects
def _brickification(img: ImageData, nblocks: Tuple[int, int]) -> ImageData:
    # Add 3D brick effects: highlights, shadows, and studs
    for i in range(nblocks[0]):
        for j in range(nblocks[1]):
            # Calculate brick center position
            xc = round(d + 2 * d * i)
            yc = round(d + 2 * d * j)

            # Apply lighting effects for 3D appearance
            # Top-left highlight
            rr, cc = disk((xc - 2, yc - 2), 0.6 * d, shape=img.shape)
            img[rr, cc] = (img[rr, cc] * 0.5 + 200 * 0.5).astype(img.dtype)

            # Bottom-right shadow
            rr, cc = disk((xc + 2, yc + 2), 0.6 * d, shape=img.shape)
            img[rr, cc] = (img[rr, cc] * 0.5 + 10 * 0.5).astype(img.dtype)

            # Central stud
            rr, cc = disk((xc, yc), 0.6 * d, shape=img.shape)
            img[rr, cc] = original_color
The final image is upscaled back to full resolution with realistic 3D brick effects including highlights, shadows, and the characteristic LEGO studs.
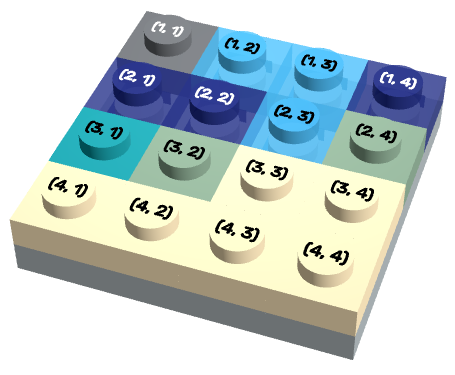
LEGO map browsing showing the tile-by-tile structure
Step 4: Web Mercator Grid Integration
Zoom Level 7 Tiling
Our LEGO mosaic uses the exact same Web Mercator tiling scheme that powers web maps worldwide. At zoom level 7, Europe is divided into manageable tiles, each corresponding to a 4×4 LEGO brick assembly.
Grid Specifications:
- Zoom Level: 7 (128×128 tiles globally)
- Europe Coverage: Approximately 26x26 tiles
- Tile Size: 256×256 pixels
- Brick Assembly: 4×4 LEGO bricks per tile
- Brick Dimensions: ~3cm × 3cm per tile
This standardization means that each conference attendee builds a specific geographic region that precisely aligns with the global tiling system used by Google Maps, OpenStreetMap, and other web mapping services.
Step 5: Instruction Generation
Building Guides and Assembly
The system automatically generates detailed building instructions for each tile, including:
"instruction_metadata": {
    "total_bricks": 16,
    "color_counts": {
        "Bright Green": 8,
        "Earth Blue": 4,
        "Dark Tan": 3,
        "Trans-Light Blue": 1
    },
    "x_position": 65,
    "y_position": 42,
    "tile_stage": "claimed"
}
Building instructions
Using a web app, attendees get precise instructions for each tile.
Step 6: Real-Time Assembly via Web App 🚀
Attendees at the ESA Living Planet Symposium will use a web app to claim tiles, view building instructions, and track progress. The app connects to the openEO by TiTiler API, allowing real-time updates as participants assemble the mosaic.
A web app for real-time assembly of the LEGO mosaic, allowing attendees to claim tiles and view building instructions.
openEO by TiTiler: The Engine Behind the Map
Our implementation combines the standardized openEO API with TiTiler's high-performance engine:
Key Advantages:
- Real-time Processing: Synchronous execution for interactive applications
- Cloud-Optimized: Built for Cloud-Optimized GeoTIFF (COG) format
- Lightweight Architecture: Focused on visualization and rapid prototyping
- Open Source: Fully open-source implementation available on GitHub
Technology Stack:
This project was powered by open-source components:
- FastAPI: Modern web framework for API development
- Rio-Tiler: Efficient raster data processing
- STAC Integration: Direct connection to STAC catalogs
- Dynamic Tiling: On-demand XYZ tile generation
Try It Yourself
Links:
Related content
More for you
Have a challenging project that could use our help?
Let's connect
We'd love to hear from you.