The Global Electrification Platform (GEP) offers a glimpse into the future of sustainable energy. Led by the World Bank in collaboration with the Energy Sector Management Assistance Program (ESMAP), World Resources Institute (WRI), KTH Royal Institute of Technology, Google, University of Cambridge, and Derilinx, this platform unravels least-cost electrification strategies from around the globe. It facilitates interaction with contextual data at the country level through various investment scenarios. This platform addresses Sustainable Development Goal 7—universal access to energy services by 2030—and can help make informed, strategic decisions to reach the goal.

Overview
The Global Electrification Platform delivers critical insights into viable strategies for sustainable energy access. Utilizing sophisticated modeling and mapping technologies, it equips stakeholders with an extensive resource for assessing and addressing the electrification requirements of underserved communities. This initiative exemplifies the power of international cooperation, uniting a diverse array of global institutions in a shared pursuit of energy sustainability.
Challenge
Balancing the need for rapid electrification with sustainable practices and financial viability is a formidable humanitarian challenge. In many parts of the globe, communities still lack access to clean and reliable energy sources. The complex nature of energy infrastructure planning, coupled with the diverse socio-economic landscapes across countries, calls for an innovative approach to devising electrification strategies that are both inclusive and practical.
Outcome
The Global Electrification Platform has produced a rich, data-driven understanding of how best to approach the electrification challenge. By providing a clear picture of the costs, benefits, and impacts of different electrification pathways, the platform empowers policymakers, investors, and community planners to make informed, strategic decisions tailored to each region's unique needs. It's a step towards lighting up homes, fueling economies, and empowering communities.
Policymakers and the general public can explore, through a lightweight interface, the least-cost electrification scenarios for forty-six countries in the Global South. Each country has more than two hundred scenarios, which vary according to parameters such as population growth, energy demand, grid cost, and other inputs selectable in the exploration view:

An electrification scenario for Malawi in 2030.
The heart of the project is the Open Source Spatial Electrification Tool (OnSSET), a modeling approach developed by researchers at KTH Royal Institute of Technology. This tool computes country-level electrification scenarios from GIS datasets, including energy infrastructure, solar irradiation, wind speeds, population density, and more. It takes a two-step approach, calculating results for the intermediate year 2025 in addition to the target year 2030.

An electrification scenario for Malawi in 2025.
Users can refine results in the filter panel, which can narrow results by technology type, network distance, cluster population, and other variables. After users apply filters, the map is updated, and a PDF report can be exported. In the example below, the scenario is filtered by settlement areas farther than one kilometer from the grid, showing results in photovoltaic energy being predominant.
Data-driven styling
To build compelling visualizations of complex models, the platform extensively uses Mapbox GL JS, a powerful Javascript library that allows plugins for vector tiles and rendering maps on the go. It offers the possibility to define several characteristics of map features, like opacity, fill colors, line widths, and others. The application does all the scenario rendering from vector tiles with the geometries of each country.
How to visualize a million features fast?
One of the biggest challenges of the project was quickly displaying country-wide electrification data. When a scenario is accessed, an API call returns the electrification type for each settlement in a country. This can be hundreds of thousands of features. We used vector tiles to make geographic features load efficiently at all zoom levels. However, we still had to include the electrification type for each feature in a country every time a scenario was accessed. We found the optimal way to solve this problem was, instead of sending an object with all feature ids, to send a vector where the index (or position) indicates the feature id. So we end up with an original representation of:
  [
    {id: 1, type: 4},
    {id: 2, type: 2},
    {id: 3, type: 9},
    {id: 4, type: 5},
    {id: 5, type: 2},
    {id: 6, type: 9},
    {id: 7, type: 7},
    ...
  ]
To:
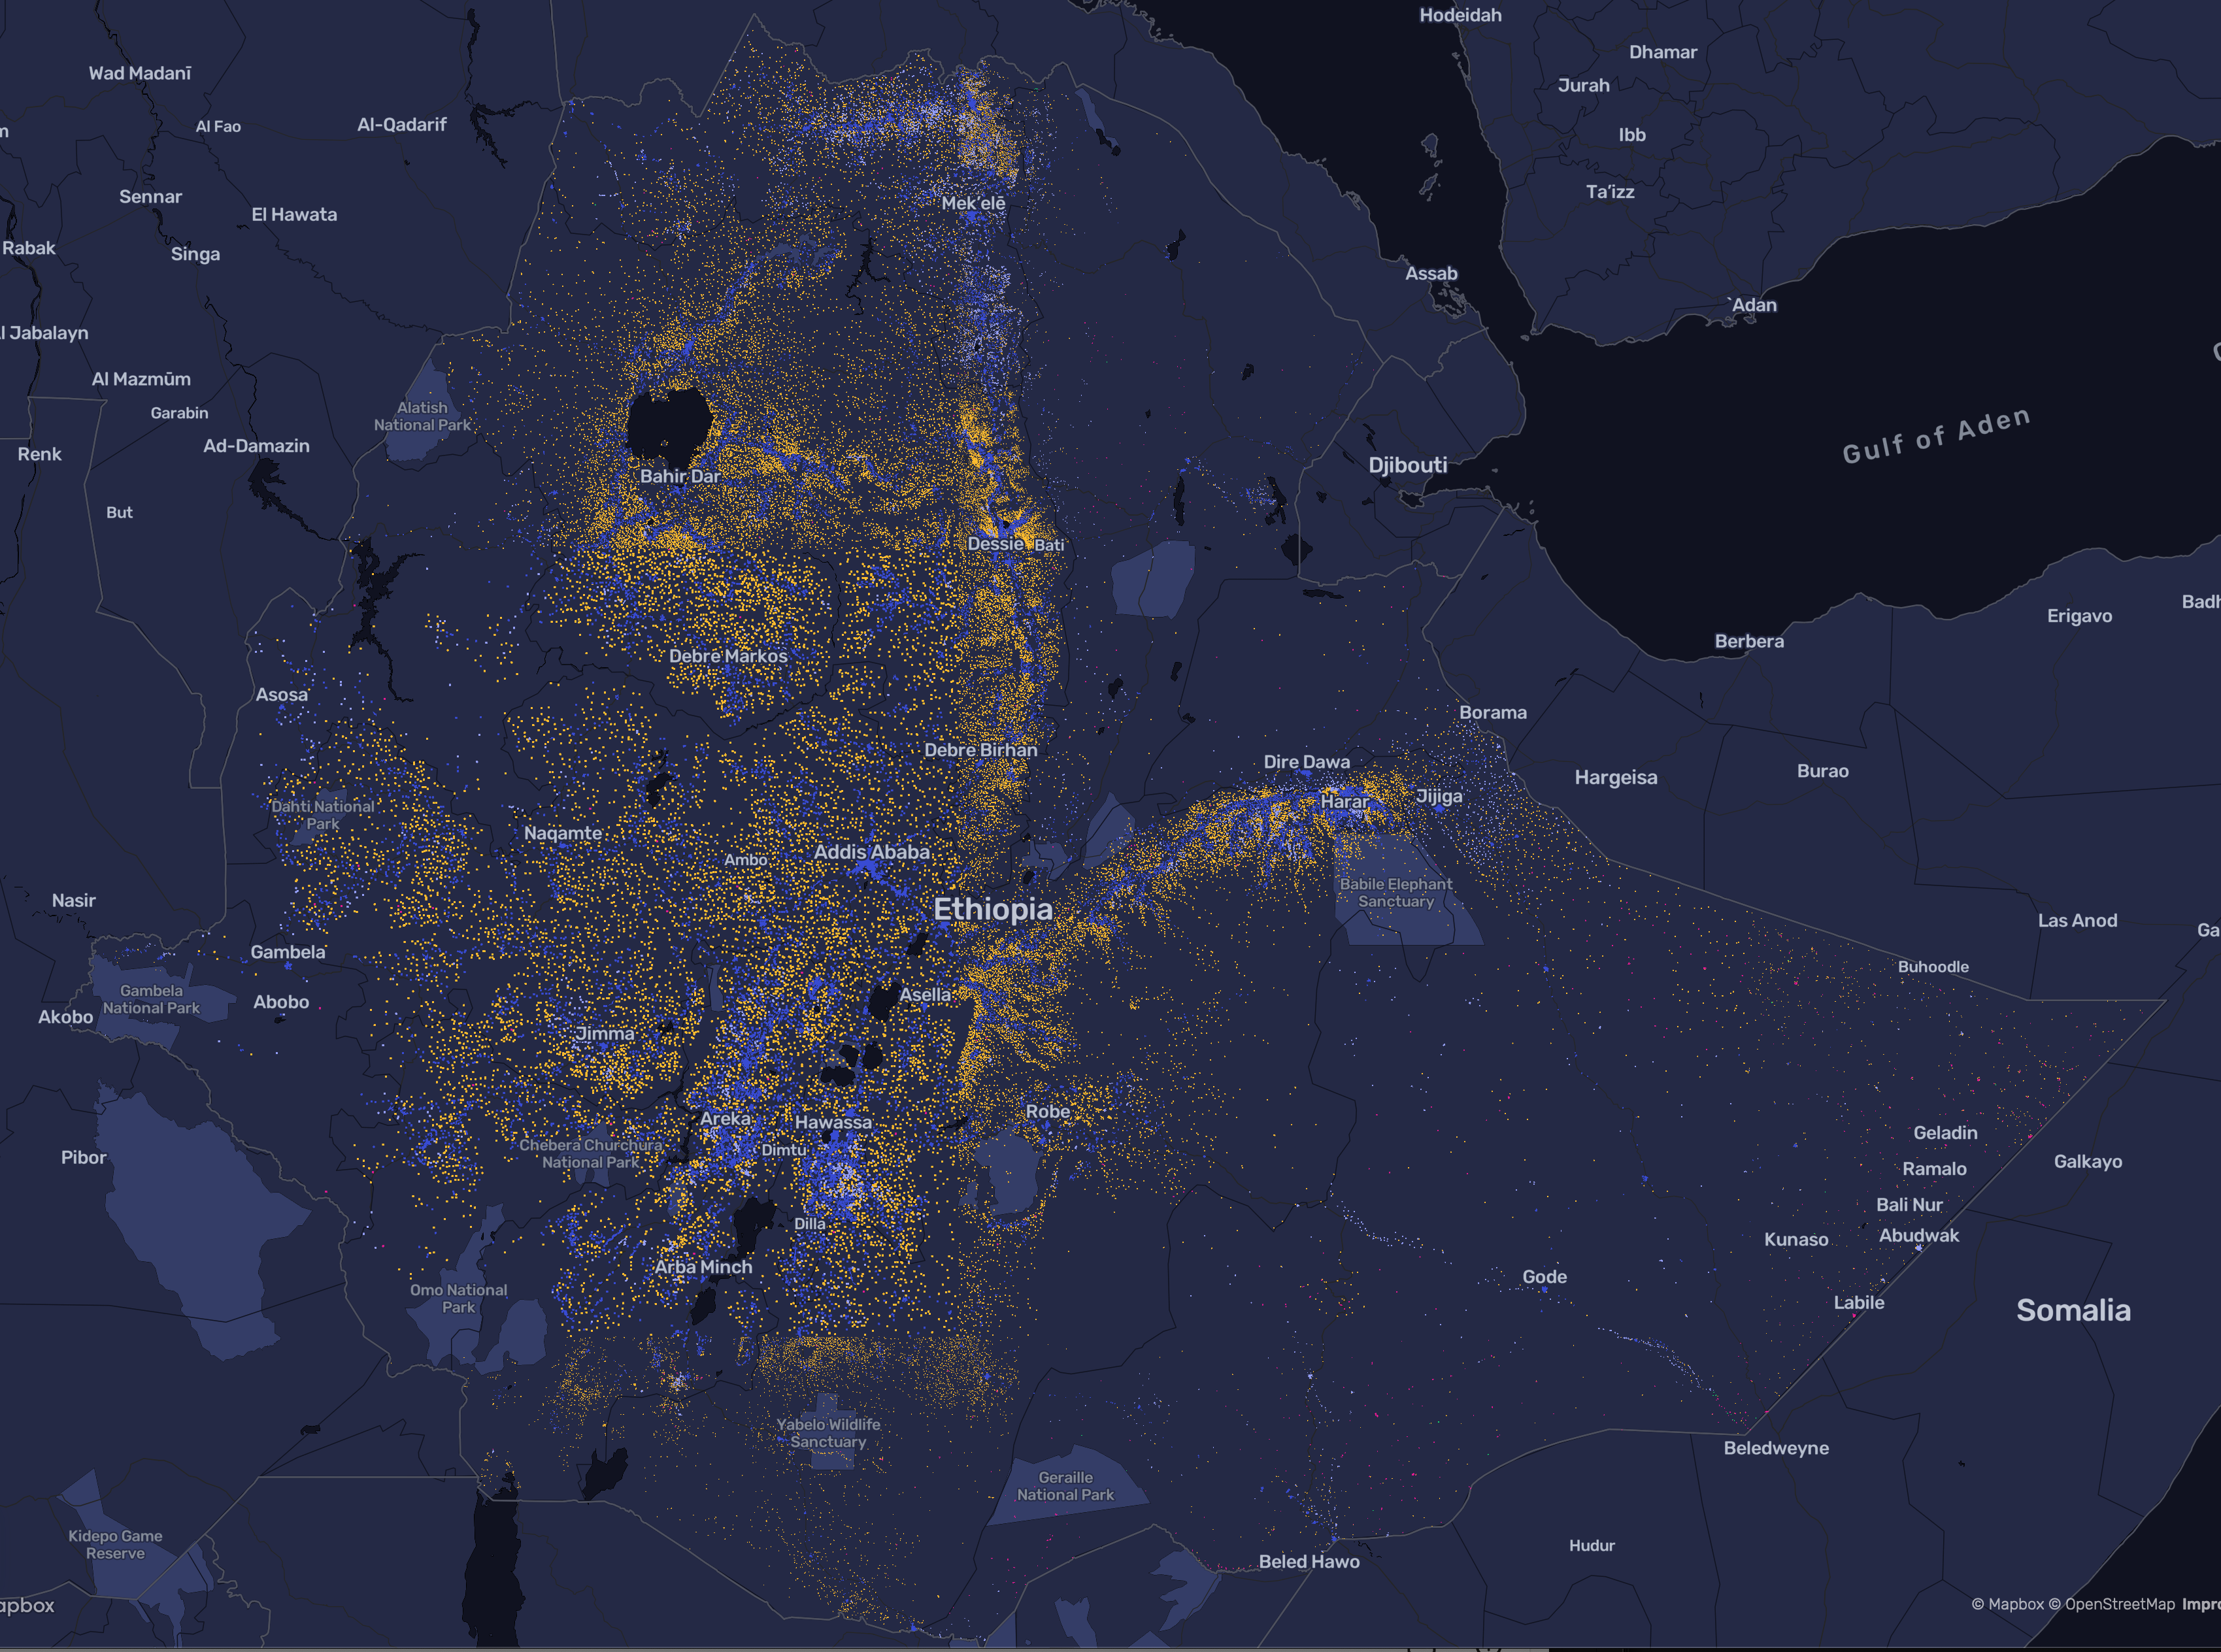
[4,2,9,5,2,9,7...]In the most sparse country, Ethiopia, there are approximately one million clusters. It would be impractical to send an id/type pair, as it would be dozens of megabytes each. With optimized encoding the browser only downloads 125 kb of gzipped data per scenario. Now the countrywide map can be loaded in seconds:

An electrification scenario for Ethiopia.
Handling terabytes of data
To ingest new models we implemented a command line interface that allows validating, ingesting, modifying and removing scenarios. Each model is made up of a set of CSV files, which contain the scenarios. It also has a model configuration file in YML format that describes the levers, filters, auxiliary maps and other features. This file defines how the exploration view is displayed to the user. It is also used for pre-validating CSV files, which ensures they have the necessary columns to enable the map and filters. It links to source data at energydata.info.
Have a challenging project that could use our help?
Let's connect
We'd love to hear from you.