

A quarterly snapshot of our experimental tools and open-source innovations, showcasing the projects that drive our curiosity forward.

Welcome back to Groundwork, our occasional roundup of experiments, prototypes, open-source projects, and technical rabbit holes from the team.
This edition includes a new approach to accessing massive raster collections with xarray, continued work on browser-based raster visualization, experiments with HEALPix for planetary-scale data, and an exploration of what geospatial embeddings can—and can't—tell us.
We hope you enjoy taking a look at what we've been building.
1. Lazy access to massive raster collections with lazycogs
Working with large collections of Cloud-Optimized GeoTIFFs often means understanding where thousands of individual files live and how they should be combined before analysis can begin. Over the last several years, projects like stackstac and odc-stac have helped popularize a different pattern: using STAC metadata to build virtual mosaics that behave like a single dataset.
Our newest experiment, lazycogs, explores a fresh take on that workflow.
Rather than reading directly from a STAC API, lazycogs starts with STAC Geoparquet. Users can cache a STAC search using rustac, or point to an existing STAC geoparquet archive, then open the collection as an xarray dataset by specifying the desired spatial extent, resolution, and coordinate reference system.
When a slice of data is requested, lazycogs queries the STAC geoparquet metadata to determine exactly which assets are needed before using async-geotiff to retrieve only the required portions of each Cloud-Optimized GeoTIFF.
Watch Henry's short talk during a recent Pangeo Showcase.
lazycogs brings together several emerging pieces of the cloud-native geospatial ecosystem into a workflow that feels simpler for users while remaining efficient under the hood. As Earth observation archives continue to grow, making data easier to access becomes just as important as making it easier to store.
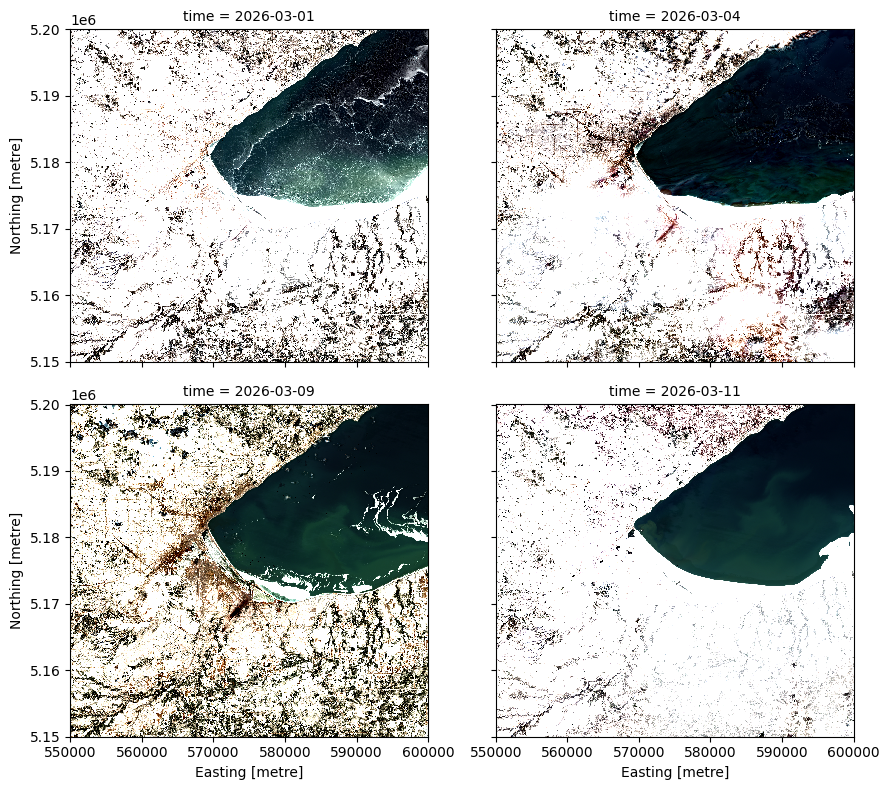
Faceted plot of HLS data showing changes in Lake Superior ice around Duluth in March 2026
Bringing cloud-native rasters to the browser
Browser-based geospatial visualization has come a long way, but working with large raster datasets has often required dedicated servers or preprocessing before data could be explored interactively.
We've continued pushing on that challenge through deck.gl-raster, our open-source project for rendering cloud-native raster formats directly in the browser.
Recent work has expanded support for multi-band Cloud-Optimized GeoTIFFs, improved GPU-accelerated raster processing, refined tile loading strategies, and laid the groundwork for GeoZarr support. Together, these advances make it possible to interact with increasingly large and complex raster datasets while relying on less server-side infrastructure.
We think this is an exciting direction for cloud-native geospatial tools. As browsers become more capable, they're evolving from simple visualization clients into powerful platforms for working directly with Earth observation data.
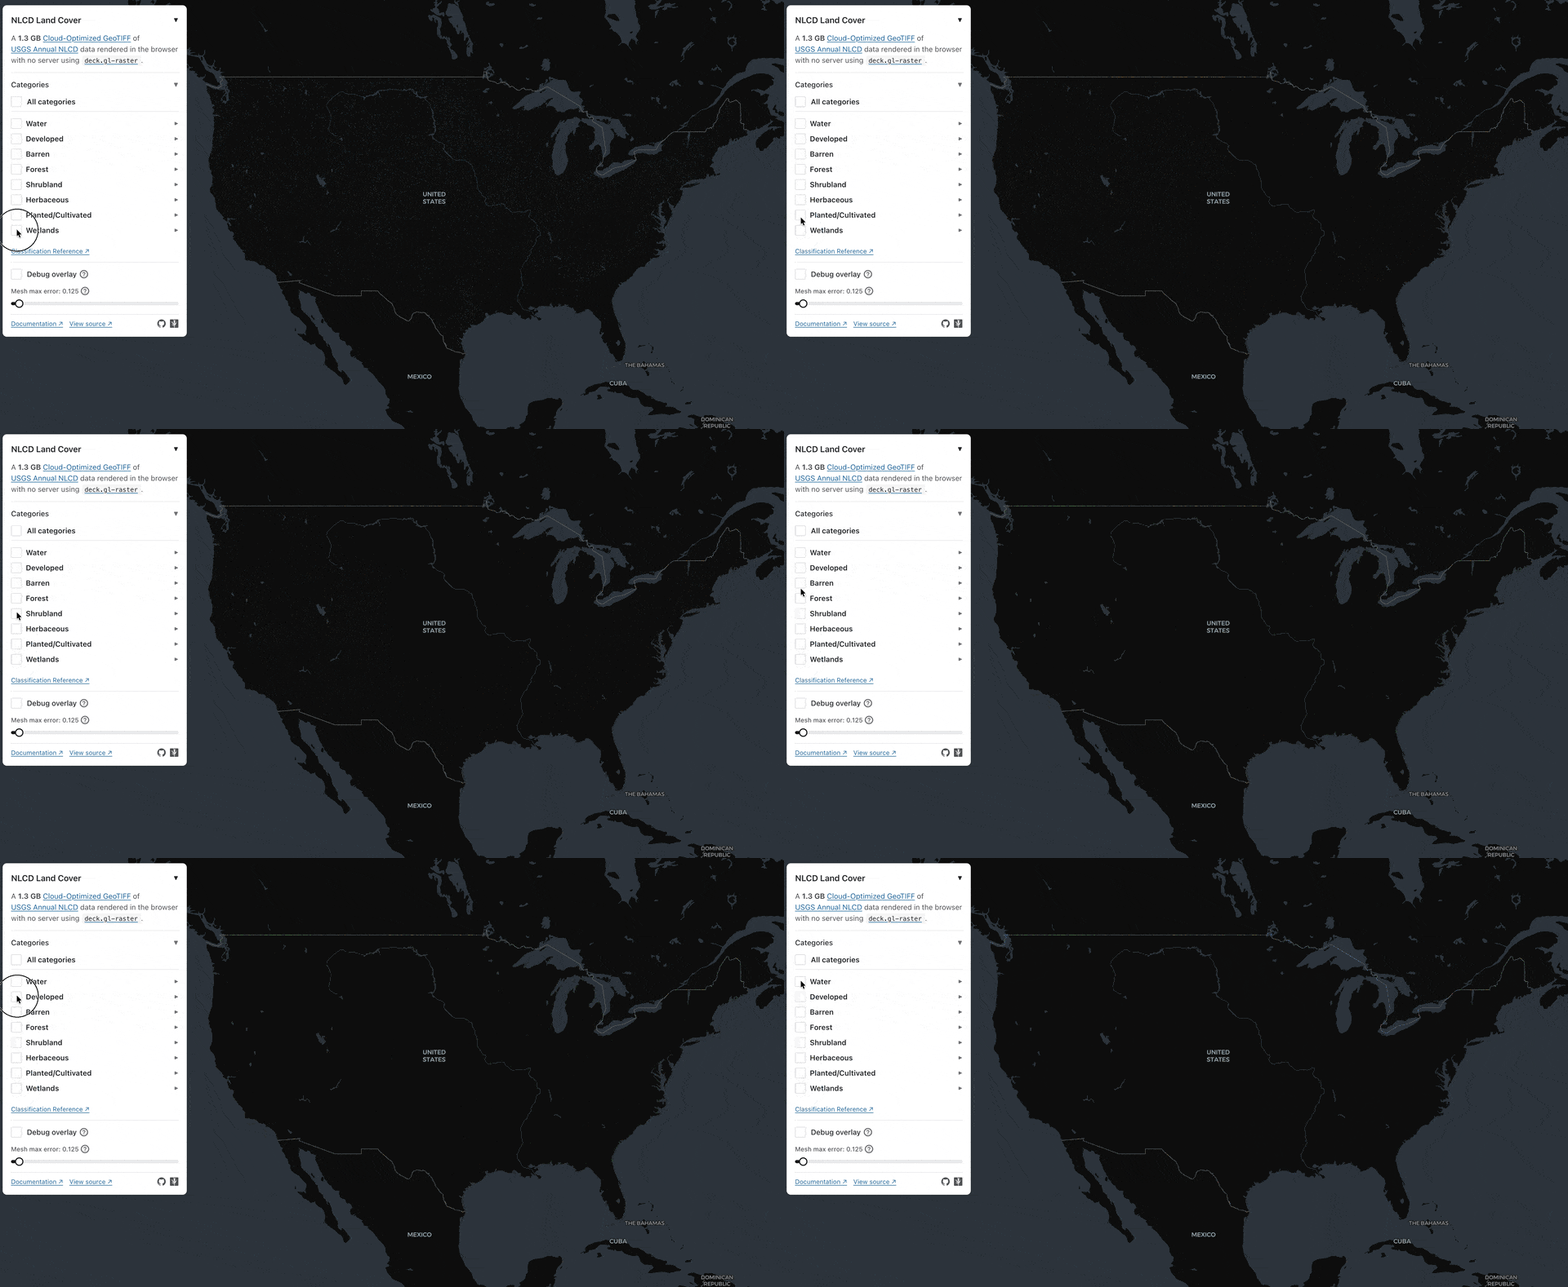
We've updated the existing NLCD Land Cover example to filter pixels by their classification. All pixel filtering happens on the fly on the GPU.
Animating the Earth with HEALPix
HEALPix has become an important way of organizing global climate and Earth observation data, including datasets like ERA5. But despite its widespread use in scientific computing, exploring HEALPix data has traditionally meant working in Python notebooks or desktop applications.
We've been exploring how modern web technologies can change that.
Building on deck.gl, we've developed a growing collection of open-source tools including healpix-ts and deck.gl-healpix that make it possible to render, animate, and interact with HEALPix datasets directly in the browser. Rather than converting data into another format for visualization, these tools render directly from HEALPix cell IDs while taking advantage of GPU acceleration for smooth, interactive performance.
One example is an interactive viewer for ERA5 climate data, where global weather patterns can be animated over time with nothing more than a web browser. By leveraging the power of the GPU for the grid calculations, the application can efficiently render the grid, allowing the exploration of temporal datasets while keeping the experience responsive. If you want something more playful, you can help paint the world of HEALPix.
This is exciting for us because it's about making planetary-scale datasets easier to explore, share, and build upon. As more Earth observation data adopts global grid systems like HEALPix, browser-native tools can help make those datasets accessible to a much broader community of researchers and developers.
Earth but make it animated.
Testing the limits of geospatial embeddings
Embeddings have quickly become a foundation for many geospatial AI workflows, enabling similarity search, retrieval, clustering, and downstream machine learning tasks. But an important question remains:
How much information do embeddings actually contain on their own?
We've been expanding Pixelverse to explore that question.
Originally built to generate embeddings from cloud-native imagery collections, Pixelverse is evolving into a toolkit for working with publicly available embedding datasets and combining them with additional sources of information.
In one recent experiment, we used publicly available Alpha Earth Foundation embeddings alongside the OlmoEarth model to investigate whether embeddings alone could distinguish between two building types across the United States.
Using UMAP to visualize the embedding space, we found that neither model produced clear separation between the building categories. While both captured meaningful structure, the lack of distinct clusters suggests that embeddings alone may not contain enough information to accurately classify these building types.
Interestingly, the Alpha Earth Foundation embeddings showed stronger clustering than OLMO Earth, potentially indicating that geographic characteristics are being encoded more strongly in the representation space.
For us, that's an encouraging result rather than a disappointing one. It reinforces that geospatial AI isn't just about finding better models—it's about combining multiple sources of information in meaningful ways. Our next experiments will explore how thermal imagery, environmental variables, and other open datasets can be fused with embeddings to build richer representations of the world.
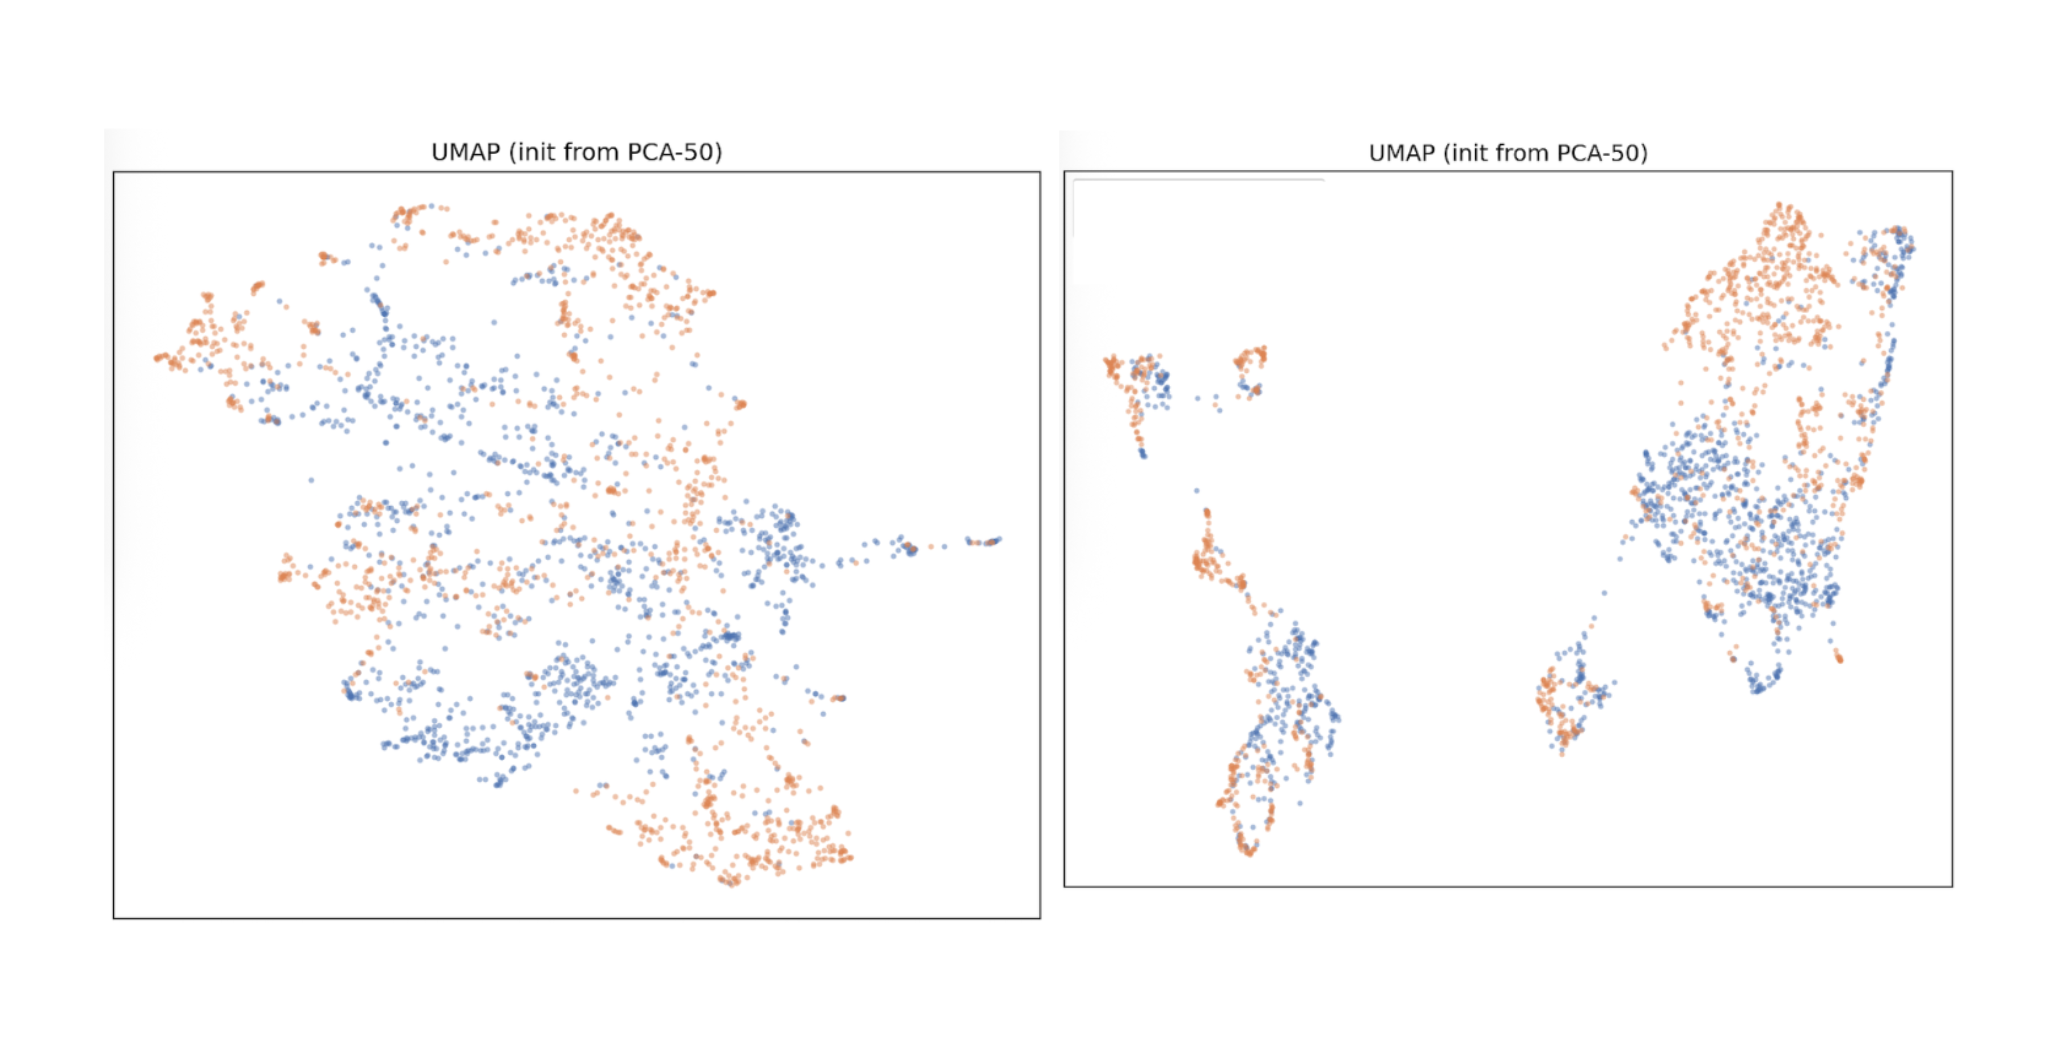
The images above show UMAP analysis of the embedding representation of the two different building types. If there were unique features encoded in the embedding space to differentiate we would expect to see clearer clusters of blue and orange dots. It is interesting to note that there is more clustering present in the AEF embeddings than the Olmo Earth embeddings. This could be because geographical differences in where these buildings are located are being captured in the AEF embeddings.
Until Next Time
These projects are all works in progress, and that's part of the point. We share them early because open source gets better through collaboration. If something sparks an idea, raises a question, or inspires a contribution, we'd love to hear from you.
Until next time, happy building.
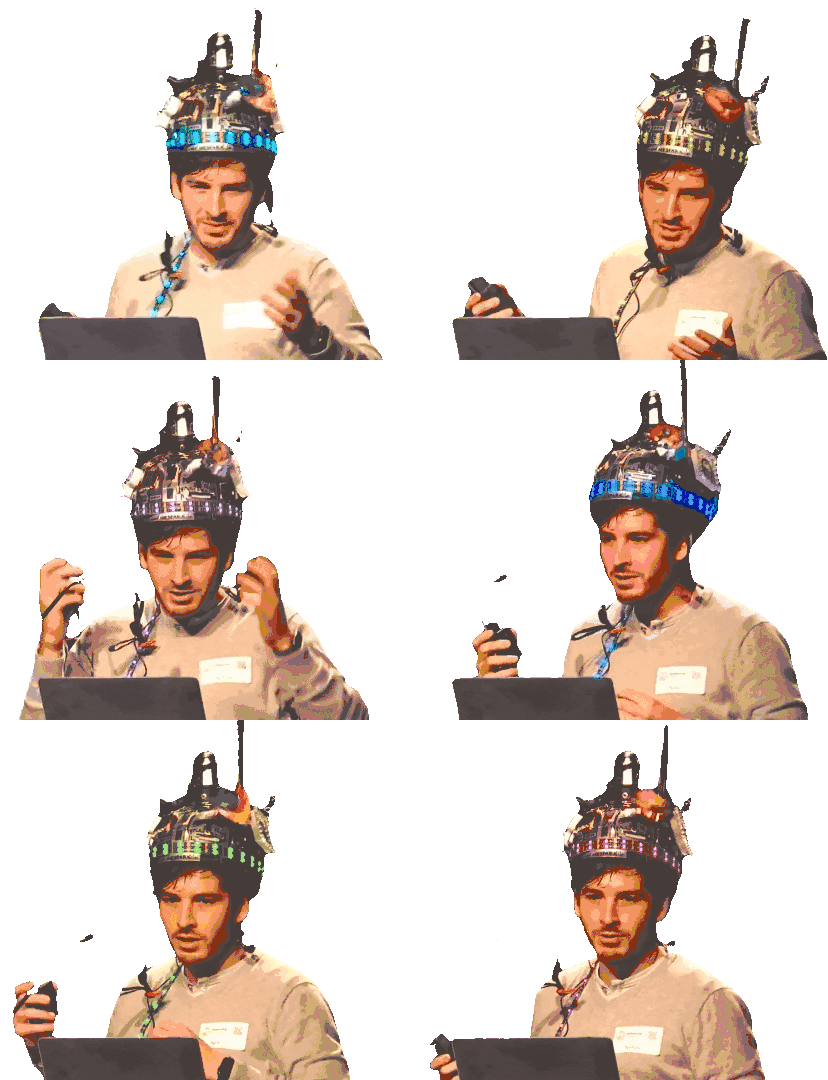
We're thrilled to share our ideas with you!
Related content
More for you
What we're doing.
Latest