

It's hard to see how open-source work connects across people, projects, and communities. We built a contributor network to step back and understand how Development Seed operates in the open, and how our contributions fit into the technologies and communities that power modern geospatial systems.

We talk about our open source work constantly. It shows up in proposals, in team conversations, and in how we explain what we do. But it’s surprisingly hard to see how that work actually connects. Each repository lives on its own, with its own contributors, history, and community.
That makes it difficult to step back and understand how we work across projects. Which tools are shaped by the same people? Where does knowledge move between teams and communities? And how much of our work happens in ecosystems we don’t own?
To answer that, we mapped it.
Part of the motivation was simple curiosity. We’ve spent years contributing across dozens of repositories, communities, and organizations, but we’d never stepped back to look at the full picture. We wanted to better understand the connections ourselves: where our work overlaps, where knowledge flows, and how our contributions fit into the broader ecosystem.
We adapted Nadieh Bremer's contributor network visualization to reflect our open source footprint. The result is an interactive view of contributors and repositories across organizations, showing how work connects across people, projects, and communities.
Special thanks to Pete Gadomski for leading the technical work to adapt the visualization for this use case.
You can explore the full network here.
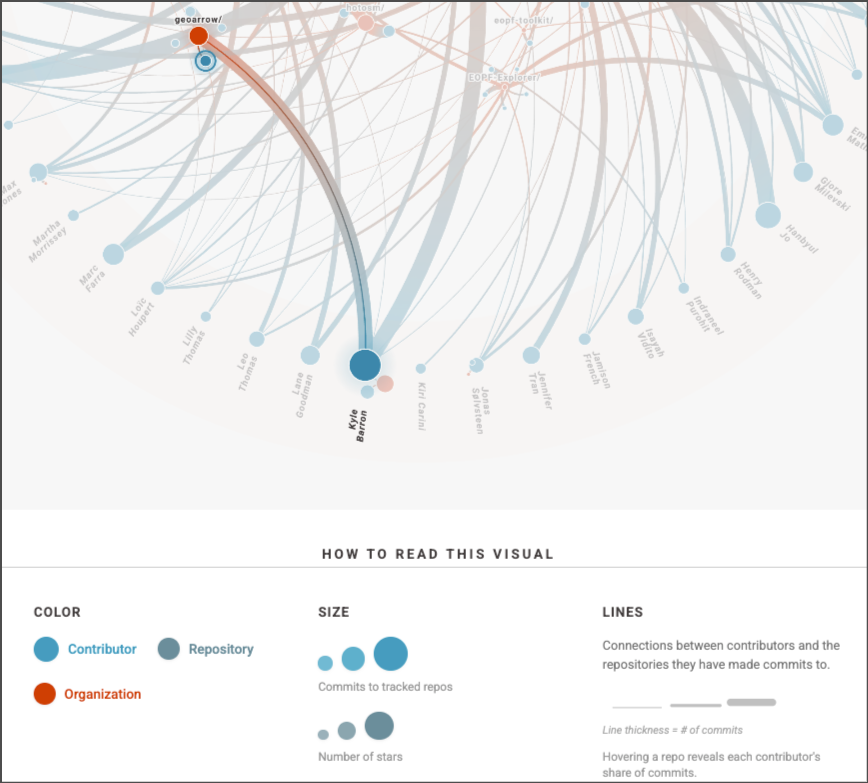
What you're looking at
This visualization shows how contributors and repositories connect across Development Seed’s open source work. Note: These are just the open repos that we contribute to. While we strive to do our work in the open, sometimes it makes sense for our partners work to be private. In those cases, we still find ourselves leaning on the open repos you see here, and using those projects to contribute back to them.
Contributors are arranged around the outside, with repositories clustered toward the center. Each line represents contributions between a person and a repository, with thicker lines indicating more commits.
Rather than focusing on individual profiles, this view shows how work overlaps. It highlights which repositories share contributors, where knowledge moves between projects, and how our work intersects with the broader ecosystem.
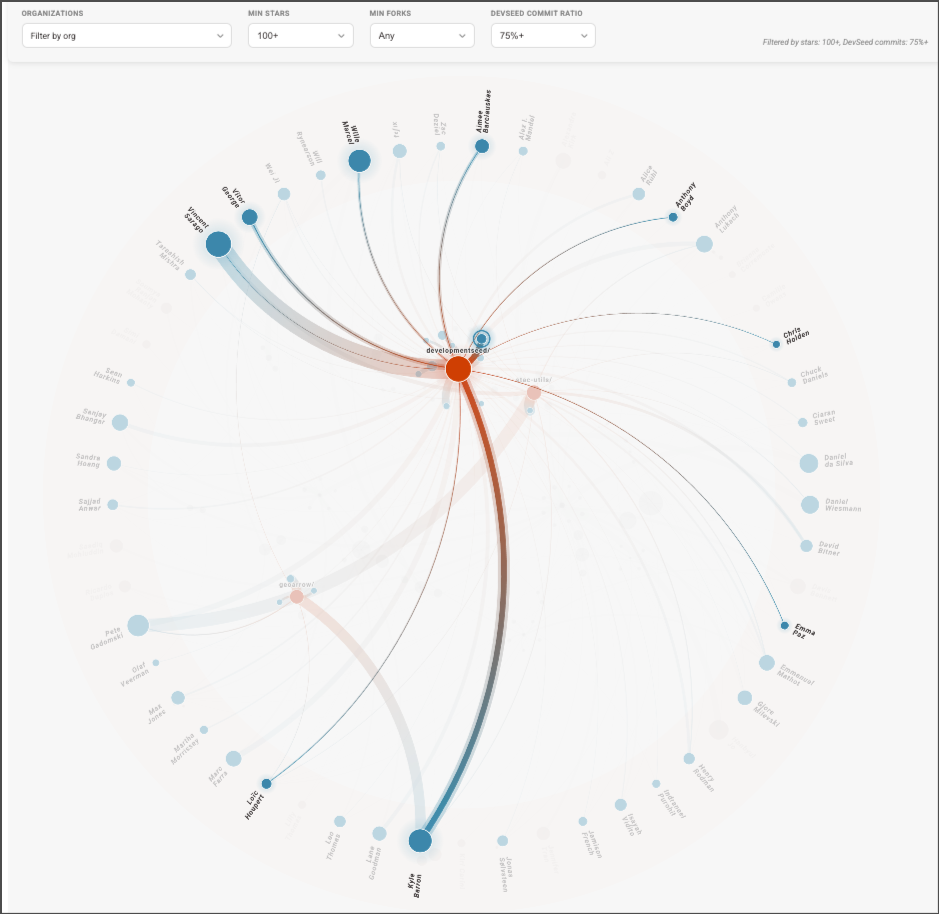
To make it easier to explore, we added filters for popular repositories, specific organizations, and projects primarily maintained by Development Seed.
Spend a minute with it. Hover over names, explore dense clusters, and follow the connections. The patterns we describe below are easier to see once you’ve interacted with it yourself.
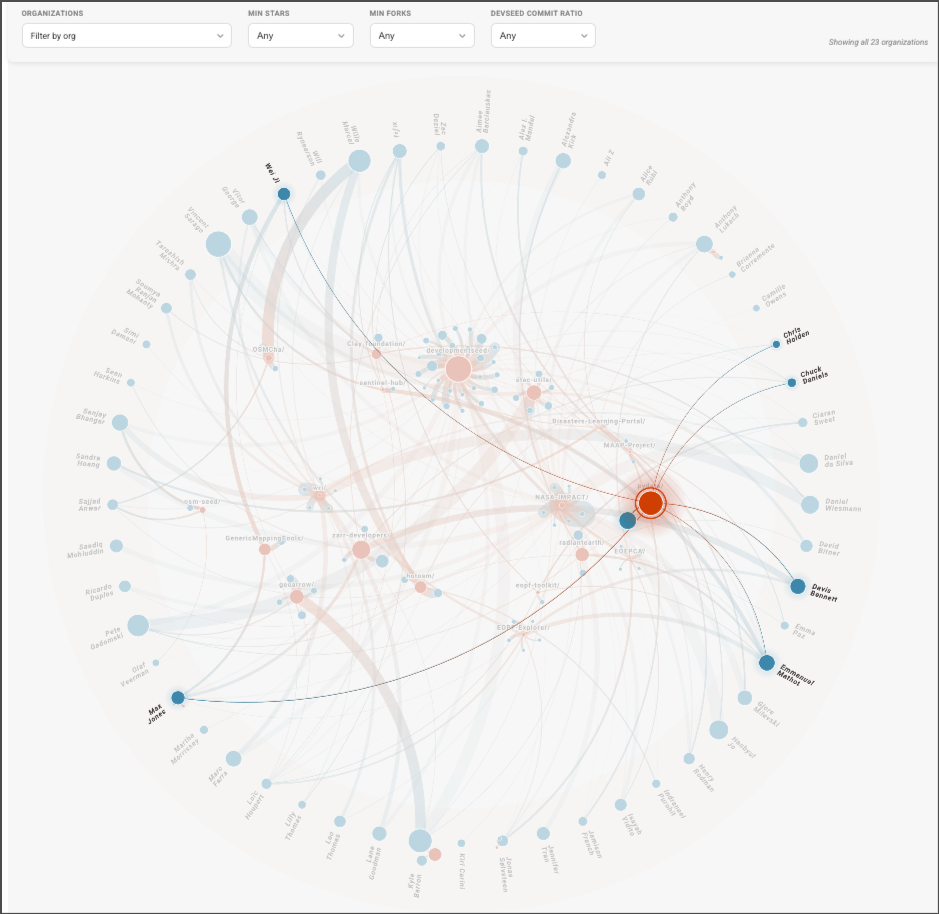
The big picture
One thing stands out immediately: most of this work doesn’t live in repositories we own.
58% of the repositories in this network are maintained outside of Development Seed. We contribute to them, help maintain them, and rely on them alongside many other organizations and contributors.
The full network includes 52 contributors and 72 repositories across 23 GitHub organizations. On average, each contributor works across five repositories, with contributions spread widely rather than concentrated in a single place.
These patterns reflect how we participate in open source. Our work spans organizations like pydata, zarr-developers, radiantearth, stac-utils, and opengeospatial. We build on top of these tools, contribute back to them, and share responsibility for keeping them healthy.
Many of the technologies our partners rely on are developed in the open, across communities rather than within a single organization. Contributing upstream helps us understand these systems more deeply, participate in their evolution, and support them over the long term.
It also helps reduce risk. Open standards and community-maintained infrastructure create more resilient systems than any single organization can build alone. The stronger these ecosystems become, the more sustainable the tools and data infrastructure our partners depend on become as well.
Looking at the network, a few patterns start to emerge.
The tools we depend on are built in the open.
Wide reach
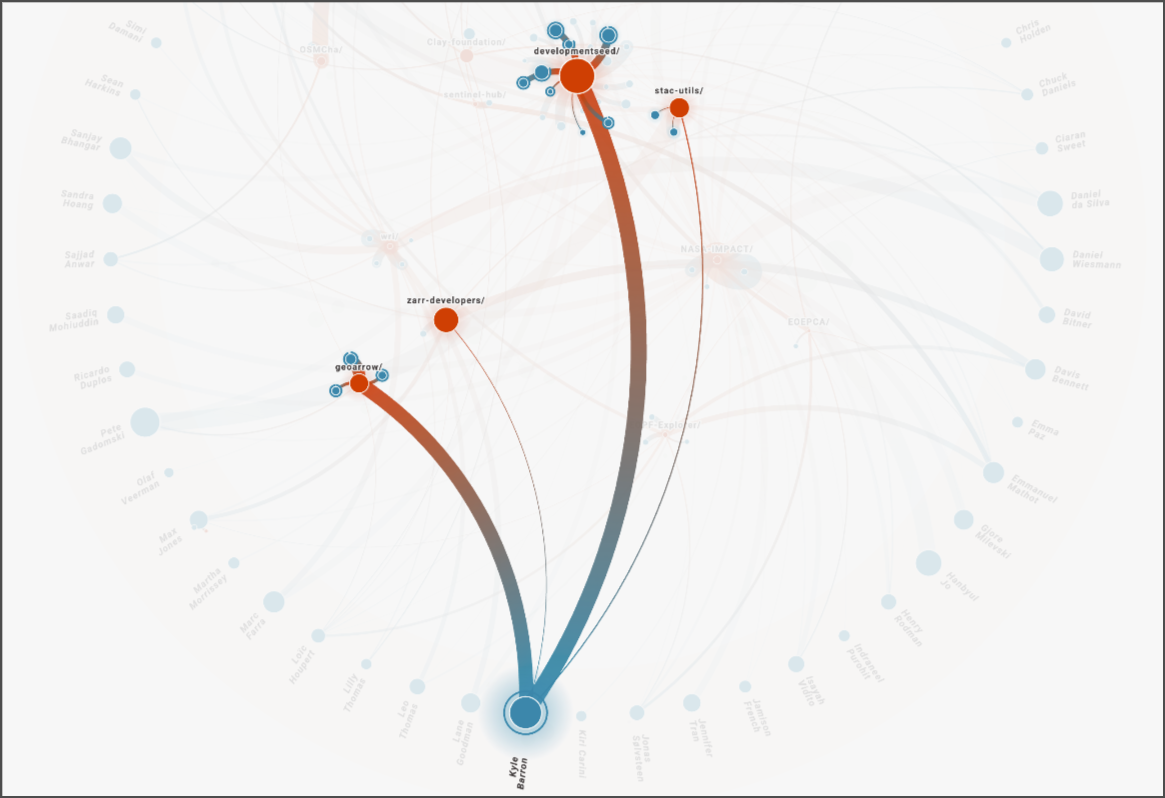
A small number of contributors work across a large share of the network.
Team members like Pete Gadomski, Vincent Sarago, and Kyle Barron each contribute to nearly 20 repositories—far above the average of five. In the visualization, their nodes sit at the center of dense clusters, with lines radiating in every direction.
The network highlights how knowledge moves between projects. The same contributors appear across many of the tools in this network, creating links between repositories, organizations, and communities.
That cross-project experience shows up in our partner work as well. The people building applications, APIs, data pipelines, and cloud-native geospatial systems are often the same people contributing to the underlying tools those systems depend on.
Sustained maintenance
Popular repositories don’t run themselves. Behind the stars is a small, consistent group doing the day-to-day work to keep them stable.
We are the primary contributors (>50% of commits) to 15 repositories with over 100 stars. For 8 of those, we contribute more than 90% of the commits.
Those repositories include DevSeed-owned repos like titiler, lonboard, deck.gl-raster and obstore. It also includes community-owned repositories such as rustac, deck.gl-geoarrow, and geoarrow-rs. It’s unglamorous work, but the ecosystem depends on it. And so do we. Many of these repositories are tools we rely on in our own projects, so maintaining them is part of how we build.
For our partners, that means the work doesn’t stop when a project launches. Investing in shared infrastructure helps strengthen the tools, libraries, and standards that continue supporting projects long after initial delivery.
Community roots
A large share of this work happens in projects we don’t own.
We contribute to repositories like zarr-python, xarray, and geoparquet—tools that are maintained by broader communities and used across the geospatial ecosystem.
The network shows this clearly. Our work is embedded in organizations like pydata, zarr-developers, radiantearth, stac-utils, and opengeospatial. We’re part of these communities, contributing alongside many others.
Shared ownership shows up throughout the network. Many of the tools we depend on are shaped and maintained by contributors from multiple organizations.
Many of the capabilities now considered foundational to modern geospatial systems—from cloud-native data formats to scalable analytics and interoperable APIs—are the result of this kind of collective investment. Contributing to these communities is one way we help ensure those foundations remain healthy and accessible.
This visualization focuses on Development Seed’s contributions, but every repository in this network reflects work from people and organizations across the ecosystem. None of these projects exist because of a single team. They succeed because communities invest their time, expertise, and energy into building shared infrastructure together.
What’s next
This visualization of our contributions is a starting point.
The code behind it is already open source, see the repo here: https://github.com/developmentseed/contributor-network
We have simplified the configuration workflow to a single file, and data gathering to a few simple scripts. This lets other organizations can easily create their own fork, configure it to point to different repos, and show data from different contributors. We want to make it easier to highlight the great open source work being done across the community, so please send us any feedback or open pull requests with improvements.
These networks provide another way to understand the relationships behind open source: who maintains what, where knowledge moves, and how communities evolve.
If you’re interested in trying it yourself, the code is available to explore and adapt. We’d be curious to see what this looks like for other organizations.
What we're doing.
Latest