
Sentinel Zarr and an Ecosystem Ready to Visualize
- Estimated
- 7 min read


Today we’re launching the EOPF Sentinel Zarr Explorer, a platform built with ESA to demonstrate what becomes possible when Sentinel data moves to Zarr. From catalogue discovery to interactive analysis and reproducible visual narratives, the Explorer shows that the Earth observation ecosystem is ready for cloud-native Sentinel workflows.

The European Space Agency's Copernicus Sentinel missions produce some of the most valuable Earth observation data on the planet, and the archive is approaching 90 petabytes. For years, working with this data has meant downloading large files, installing mission-specific software, and navigating with formats designed before cloud computing.
ESA's Earth Observation Processor Framework (EOPF) changes that. Sentinel data is transitioning from SAFE archives to Zarr, a cloud-native format that treats data as an API instead of a file to download.
This shift raises a practical question: is the visualization and analysis ecosystem ready?
The EOPF Sentinel Zarr Explorer is our answer. It demonstrates how Sentinel Zarr products can be discovered through open standards, explored dynamically in the browser, analyzed through reproducible workflows, and embedded into narrative visualizations. All of it happens directly from cloud storage.
In practical terms, this means you can explore Sentinel data without downloading massive files or installing specialized software. Everything from previewing scenes to running analyses happens in the browser, using open tools that work across the geospatial ecosystem.
Why this matters: because reducing technical barriers means more researchers, agencies, and practitioners can work with Sentinel data faster and more effectively.
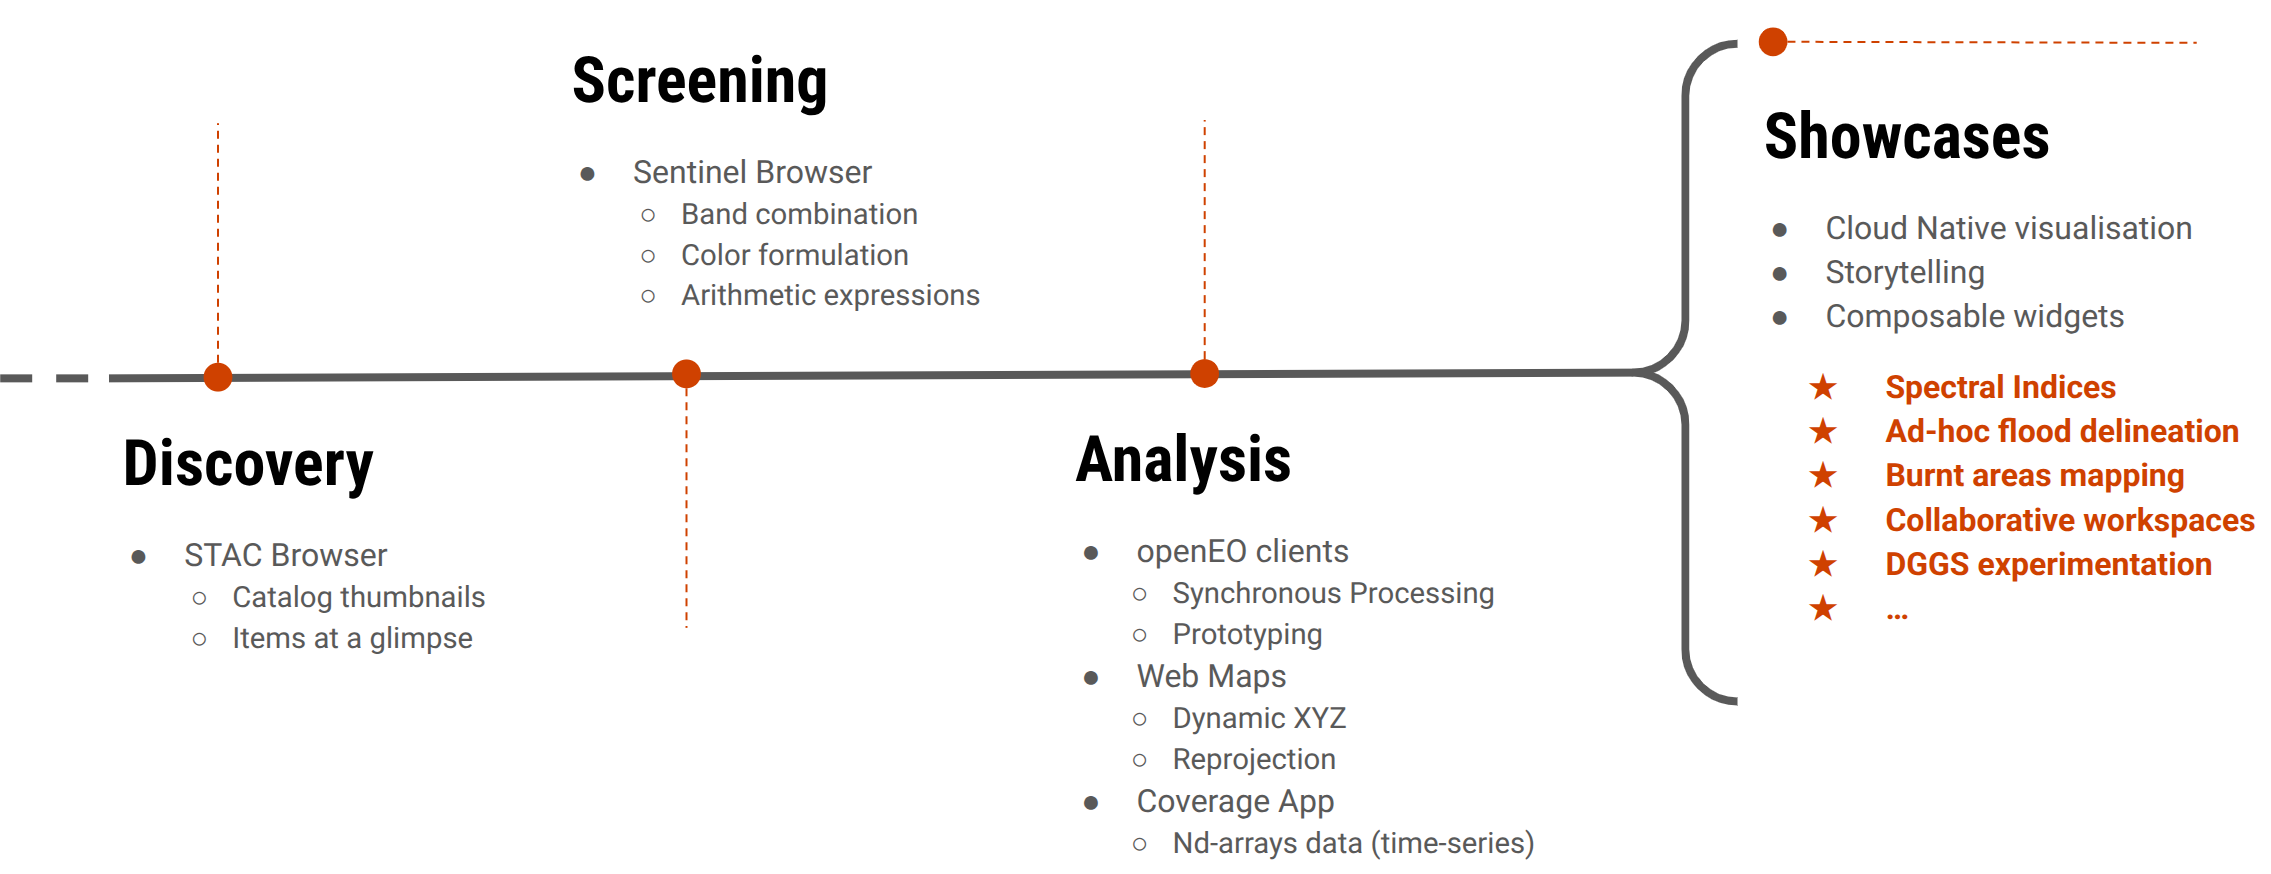
A complete journey from discovery to analysis to storytelling, all powered by Sentinel Zarr data in the cloud is proposed to users of the EOPF Sentinel Zarr Explorer.
Discovery: finding your data in the cloud
Every Earth observation workflow starts with discovery. If Sentinel Zarr is to succeed, it must be discoverable through open, FAIR, interoperable principles rather than bespoke portals.
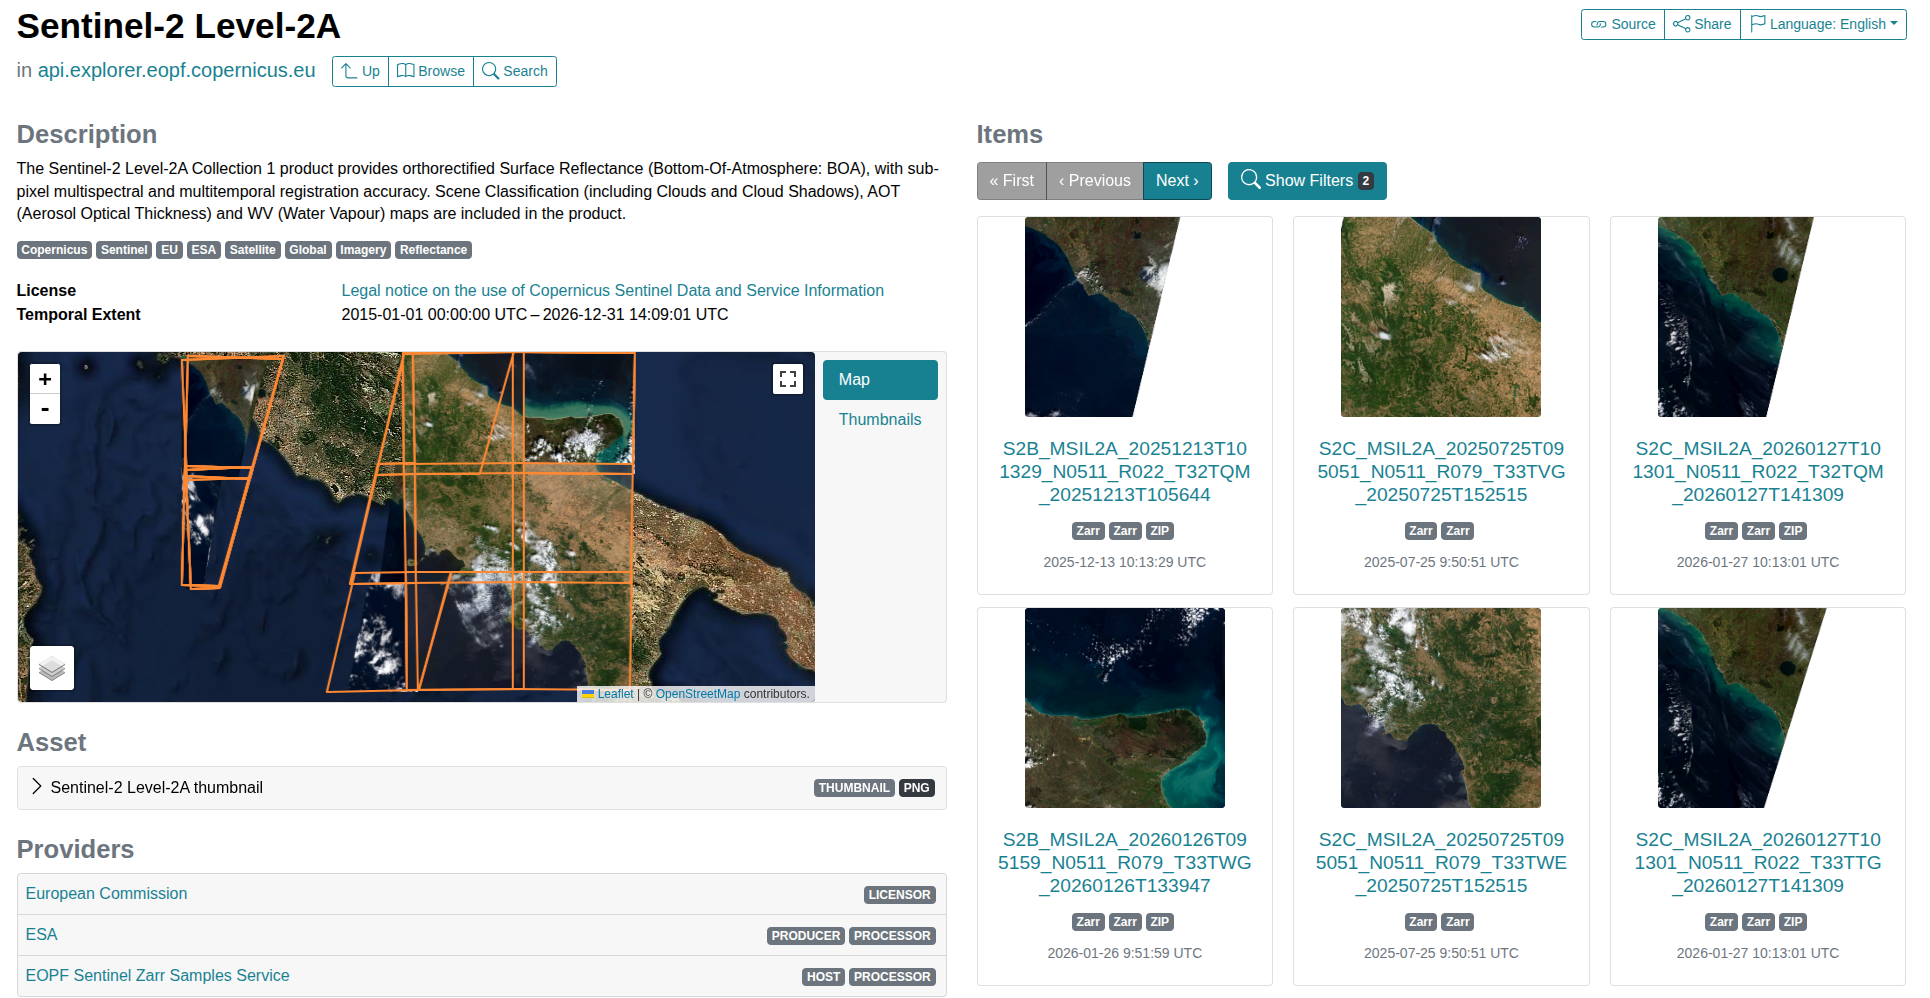
The EOPF Explorer integrates with STAC (SpatioTemporal Asset Catalog) to make Sentinel Zarr products browsable through familiar tools like the STAC Browser. You can explore the catalog, preview scenes, and understand what is available before committing to analysis. These interactions rely on community standards that work across the geospatial ecosystem, not just within this platform.
The Explorer also implements the STAC+Zarr best practices established at the STAC sprint in Rome. As a result, the internal structure of each Zarr store is discoverable through the STAC API, ensuring that multidimensional data remains accessible through the same interfaces that power the broader ecosystem.
EOPF Explorer STAC Browser
Screening: seeing your data before you process it
So you've found a scene that looks promising. Now what? Traditionally, you'd download it, load it into desktop software, and start experimenting with spectral band combinations to see if the data actually contains the information you're looking for. With the EOPF Sentinel Explorer, that entire step happens in your web browser.
You can switch between Sentinel-1 radar and Sentinel-2 optical imagery, experiment with band combinations, adjust colour maps and contrast, or apply arithmetic expressions. Every visualization is rendered dynamically from the Zarr products in cloud storage through our TiTiler web API. There is no pre-rendered imagery here, and no tiles baked in advance. The data you see is computed on the fly, which means you can explore any combination of bands and parameters without depending on someone to have anticipated your specific need.
EOPF Explorer Sentinels Browser
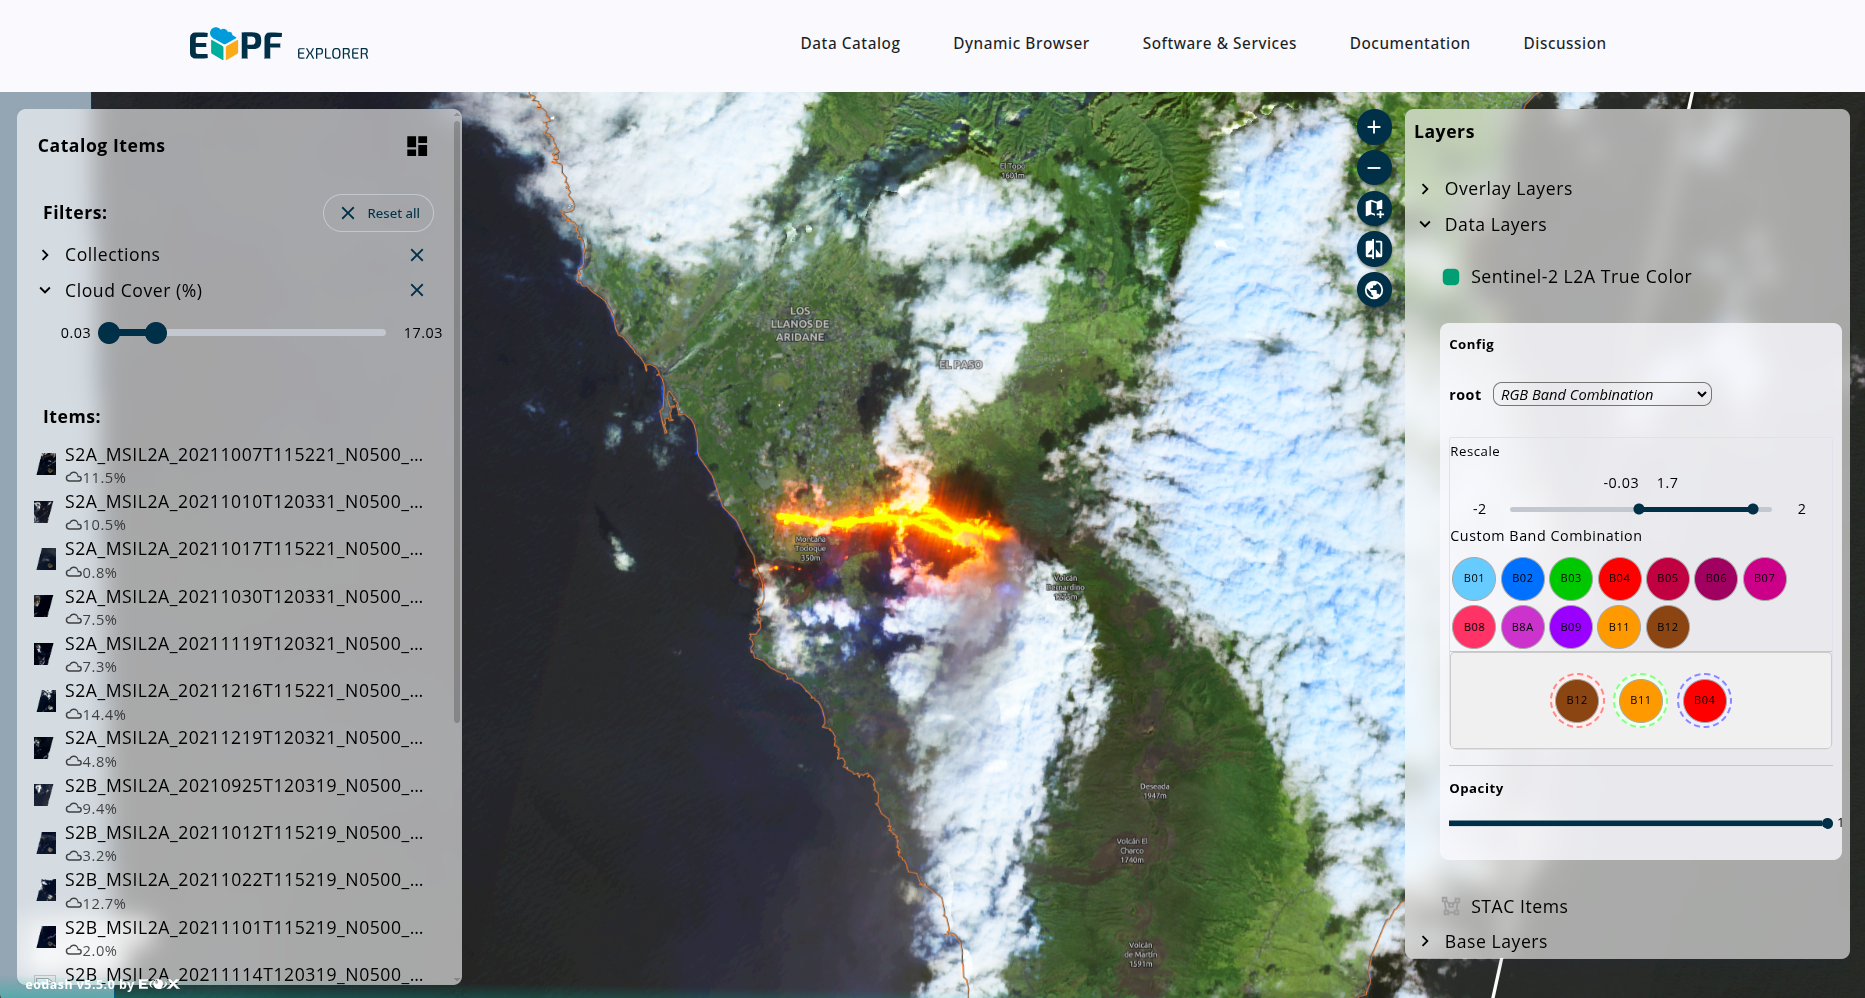
Sentinels Browser showing a Sentinel-2 scene over Cumbre Vieja, La Palma, Spain, on Oct 10th 2021 with a custom band combination to highlight lava flows.
Test it out
Using OpenLayers and WebGL with the new GeoZarr source, you can search the STAC catalog, draw a bounding box, and instantly visualize Sentinel-2 imagery directly in the browser. Try it yourself below.
✏️ Draw a rectangle on the map to search for available scenes in that area.
Create your mosaic !
Analysis: from exploration to workflows
Discovery and screening provide context. Analysis is where reproducible workflows begin.
This is where openEO Studio comes in. It provides a browser-based environment for writing openEO Python and seeing the results rendered immediately as a map. There is no local setup, no package management, and no mission-specific software required.
You load a collection, select bands, define a processing graph, and press apply. The result is rendered directly from the Sentinel Zarr source data through titiler-openeo.
The barrier between an idea and a working analysis is now just a few lines of code.
EOPF Explorer openEO Studio
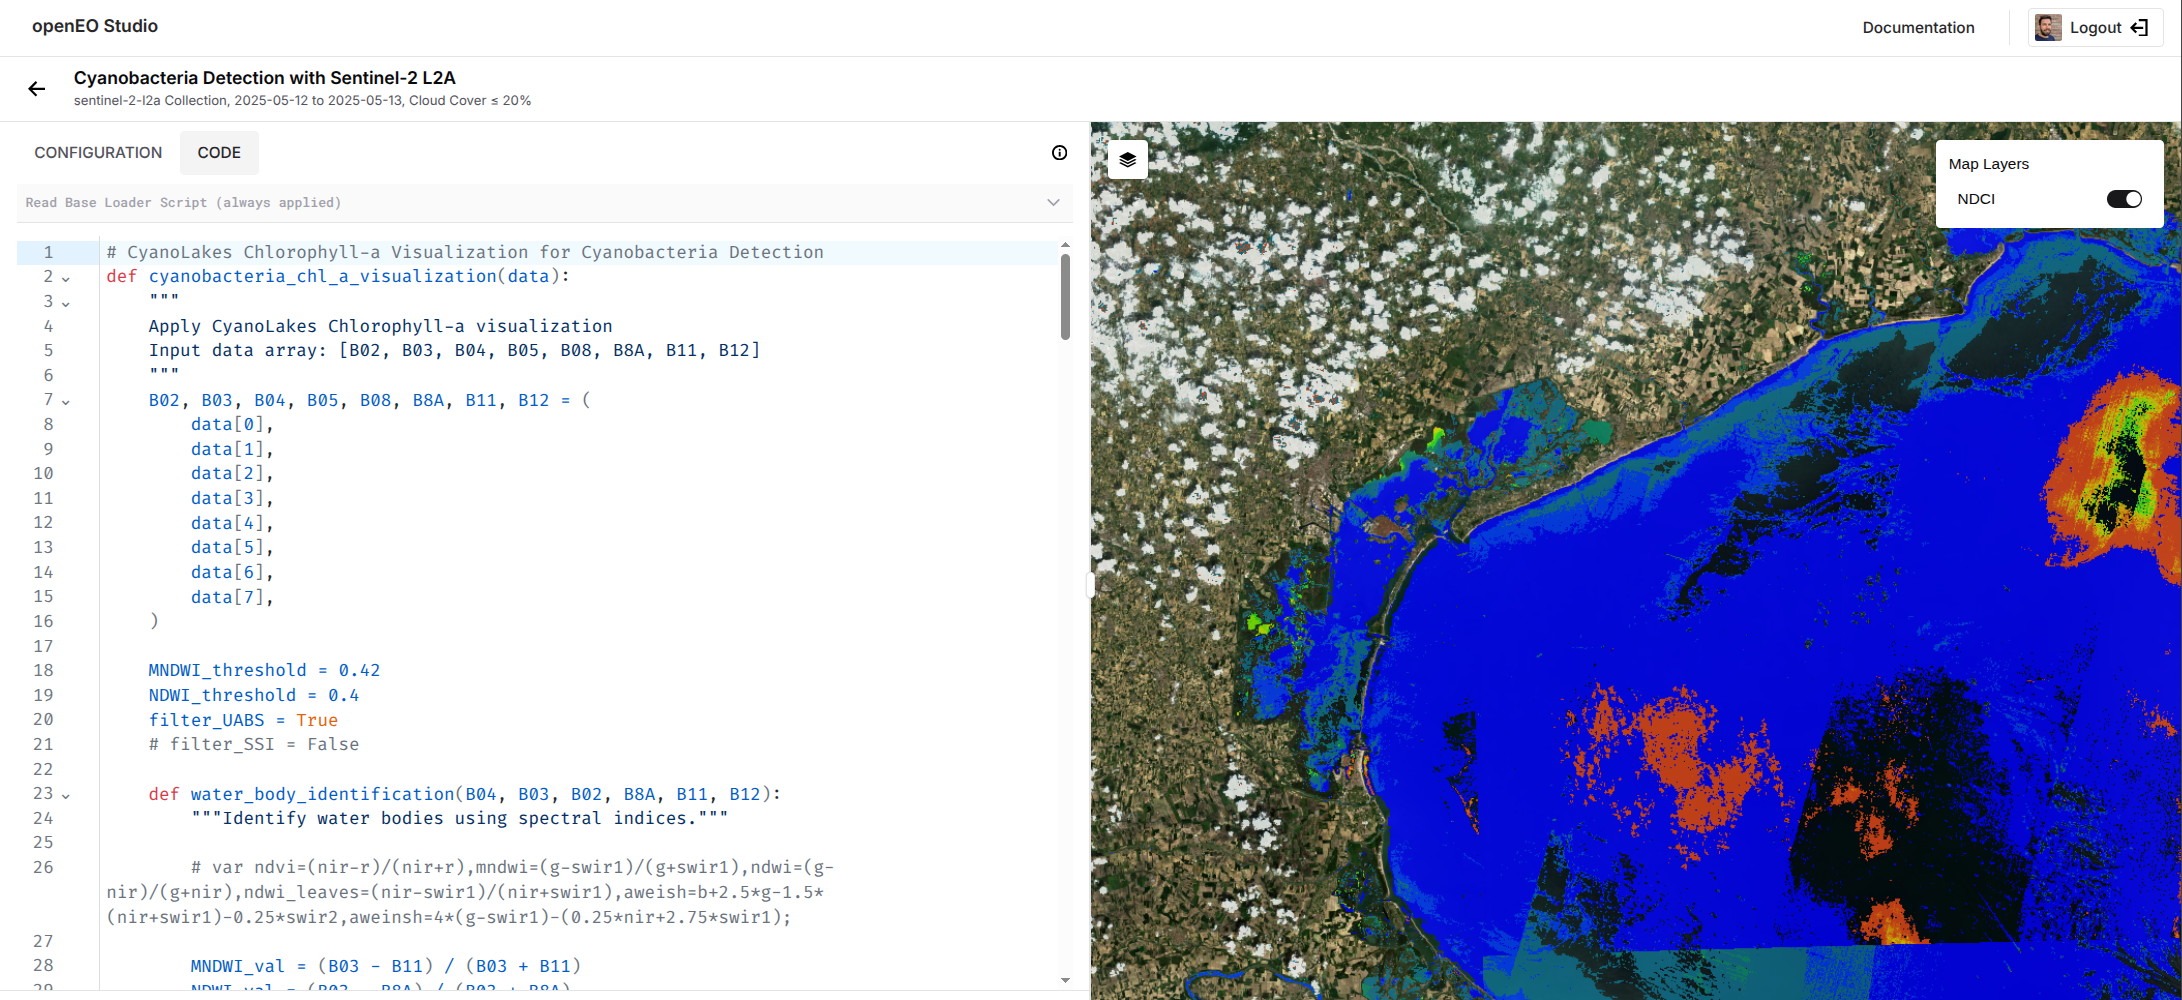
The Venice Lagoon showcase reveals algal bloom patterns invisible to the naked eye using NDCI computed in openEO Studio and rendered through titiler-openeo.
Showcases: telling stories with satellite data
Discovery, screening, and analysis come together in our interactive showcases, where we demonstrate what becomes possible when cloud-native data is paired with dynamic visualization.
The Venice Lagoon showcase reveals algal bloom patterns invisible to the naked eye using NDCI computed dynamically from Sentinel-2 data.
This showcase follows the story of monitoring cyanobacteria in the Venice Lagoon. Using the Normalised Difference Chlorophyll Index derived from Sentinel-2 data, the narrative takes you from a natural color view of Northern Italy down into the lagoon ecosystem, revealing algal bloom patterns that are invisible to the naked eye. You can see how chlorophyll concentrations shift between the industrial northern lagoon near Marghera, the historic centre, and the aquaculture areas near Chioggia, and how these patterns evolve across seasons.
What makes this possible is that every single visualization in the story is being computed on the fly. Nothing is pre-baked. Each transition is a different openEO process graph being executed in real time against the Sentinel Zarr products in cloud storage. The story itself is fully reproducible. We've linked the Jupyter notebooks, the scrollytelling framework, and the openEO workflows that power each view.
This is the pattern we want to establish: compelling visual narratives that are not static images but living connections to the data, where any reader can trace the path from a striking visualization back to the source product and the processing workflow that created it.
A community-driven data model
There's a deeper story beneath the platform. When we began this project, we had a choice: build a bespoke data model optimized for our own tools, or work with the Zarr community to establish conventions that others could adopt. We chose the latter.
In collaboration with the Zarr community, including work at the Zarr Summit in Rome in October 2025, we helped establish a modular approach to geospatial Zarr standardization. Rather than defining a monolithic GeoZarr specification, we contributed to a set of focused Zarr Conventions that can evolve independently:
- Multiscales, for pyramid information enabling progressive visualisation,
- Projection, for CRS and datum encoding
- Spatial, for relating array indices to coordinates.
This approach allows data publishers to adopt conventions incrementally across the ecosystem. GDAL 3.12 supports EOPF Zarr, and upcoming releases will align with these conventions. Desktop tools like QGIS, ArcGIS, and ENVI can read the same data. OpenLayers renders GeoZarr client-side in the browser. Libraries like rioxarray are integrating support.
The result is that EOPF Zarr data is accessible across the broader Earth observation ecosystem without mission-specific software.
This matters because the value of a data format is not defined by a single application, but by how widely it can be used. By grounding EOPF Zarr in open, community standards, ESA's investment benefits the entire ecosystem.
Explore it yourself
The EOPF Sentinel Zarr Explorer is live at explorer.eopf.copernicus.eu.
You can browse the data catalogue, experiment with the Sentinel Browser, try openEO Studio, and explore the interactive showcases. The full software and services portfolio documents all the open-source tools and APIs available to implementers and users building on EOPF Zarr applications.
We will host a series of webinars to help you get started. The first session, an introduction to EOPF GeoZarr goals and resources, takes place on 9 March 2026. A follow-up hands-on workshop will come shortly after for those who want to go deeper.
Register now for our upcoming webinars!
This project is funded by the European Space Agency through the Copernicus Space Component programme, and developed by a consortium led by Development Seed and EOX, with community outreach led by thriveGEO.
We're grateful to the many contributors who helped shape both the tools and the standards, including maintainers across GDAL, OpenLayers, TiTiler, xarray, and the Zarr community.

Cloud-native Earth observation data only delivers value when it is supported by interoperable tools, reproducible workflows, and open standards. The EOPF Sentinel Zarr Explorer demonstrates that this foundation is in place.
Visit https://explorer.eopf.copernicus.eu to start exploring.
Related content
More for you
What we're doing.
Latest