
Distilling climate science for decision making in Vanuatu
- Estimated
- 8 min read


You don’t need the most advanced models or infrastructure to do meaningful climate work. With the right data, cloud-native access, and fit-for-purpose tools, small teams can support real decisions under real constraints.

Small island nations face outsized climate risk while operating with limited technical and human resources. In places like Vanuatu, climate change and natural hazards are not abstract future scenarios. Tropical cyclones, flooding, coastal change, and coral stress, shape daily decision-making for government agencies responsible for public safety, infrastructure, and long-term planning.
The challenge is not a lack of data. Satellite imagery, climate models, and global datasets are widely available. The harder problem is access, usability, and fit. Many tools and workflows are designed for well-resourced contexts, where large teams, reliable connectivity, and access to powerful computers are taken for granted. In constrained settings, greater complexity does not necessarily mean greater utility.
Our partnership with the Vanuatu Bureau of Statistics (VBoS) focuses on right-sizing technology for local needs. Rather than pursuing the most advanced systems possible, we worked with local partners to distill climate science down to what is practical, reliable, and usable today. In practice, this approach is about giving decision-makers timely, reliable information they can use for preparedness, emergency response, and long-term planning, without adding technical burden.
As part of this effort, we are releasing a suite of open tutorials for climate change monitoring and natural disaster preparedness, developed in partnership with VBoS and supported by Digital Earth Pacific (DEP) and The Pacific Community (SPC). These tutorials are paired with a Management Information System used to host and visualize data that informs policy for the Government of Vanuatu. Read more about Vanuatu’s data-driven disaster response.
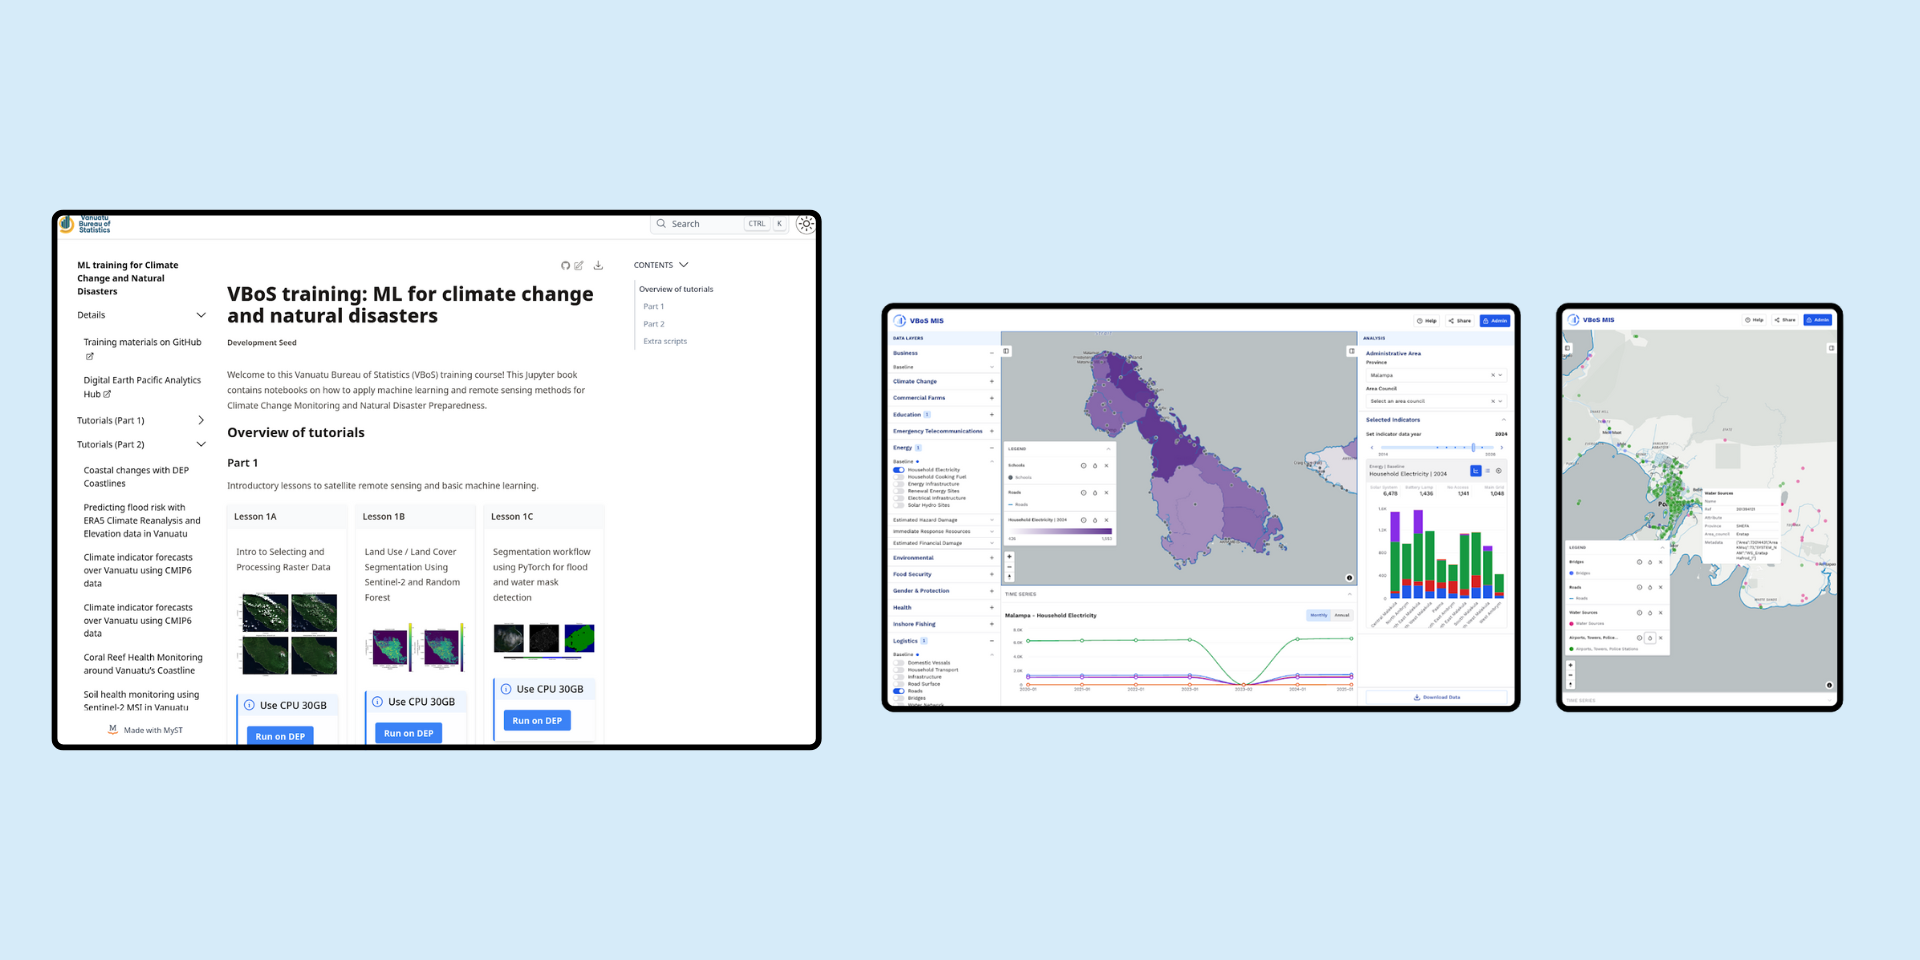
Tutorials paired with a Management Information System
Answering the call of Vanuatu
Our formal engagement with VBoS began in late 2024, with the goal of developing training materials to support climate resilience and disaster preparedness. Early sessions quickly revealed a key constraint: internet connectivity. During our first online lessons, participants were introduced to accessing and processing Sentinel-2 optical satellite imagery using libraries such as pystac-client and odc-stac. At the same time, video calls struggled to remain stable while more than a dozen participants attempted to download gigabytes of data.
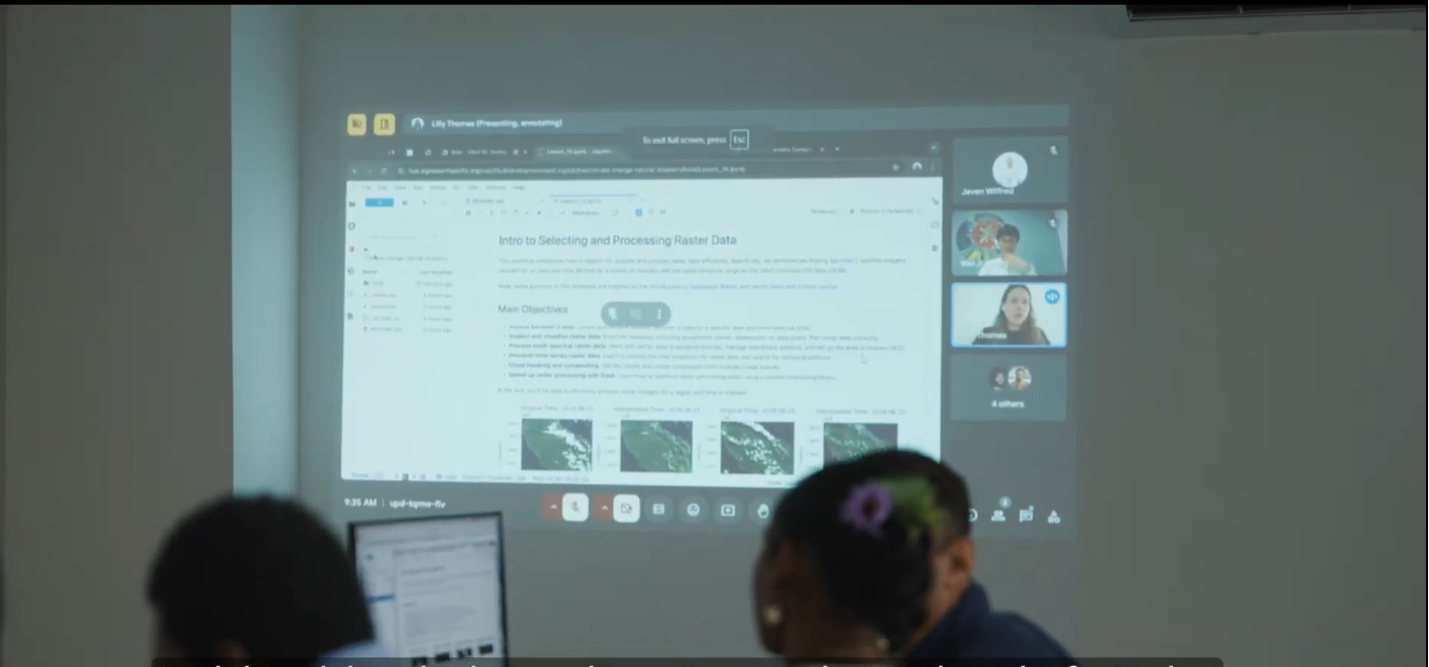
To address this, participants were given access to DEP’s Analytics Hub — a cloud-hosted JupyterHub environment with direct access to satellite imagery and a shared compute setup. This avoided the need for large local downloads and provided a consistent environment for running analyses. The Hub also offered access to GPUs, which later became important for running machine learning workflows that would have been tricky to configure locally in a fully remote course setting.
In December 2024, an earthquake struck Vanuatu, causing widespread damage in Port Vila, including disruptions to a submarine internet cable. While no one we knew from VBoS was hurt thankfully, the organization was forced to relocate offices and connectivity issues persisted for several months. The experience underscored an important reality: even cloud-based systems remain dependent on local infrastructure, for better or worse.
Using classic machine learning where it works
In this context, classic machine learning algorithms proved both effective and practical. Random Forest models, for example, could be trained in minutes, great for fitting into a 2-hour lesson. These were applied to a Land Use Land Cover (LULC) classification task using cloud-free Sentinel-2 L2A imagery.
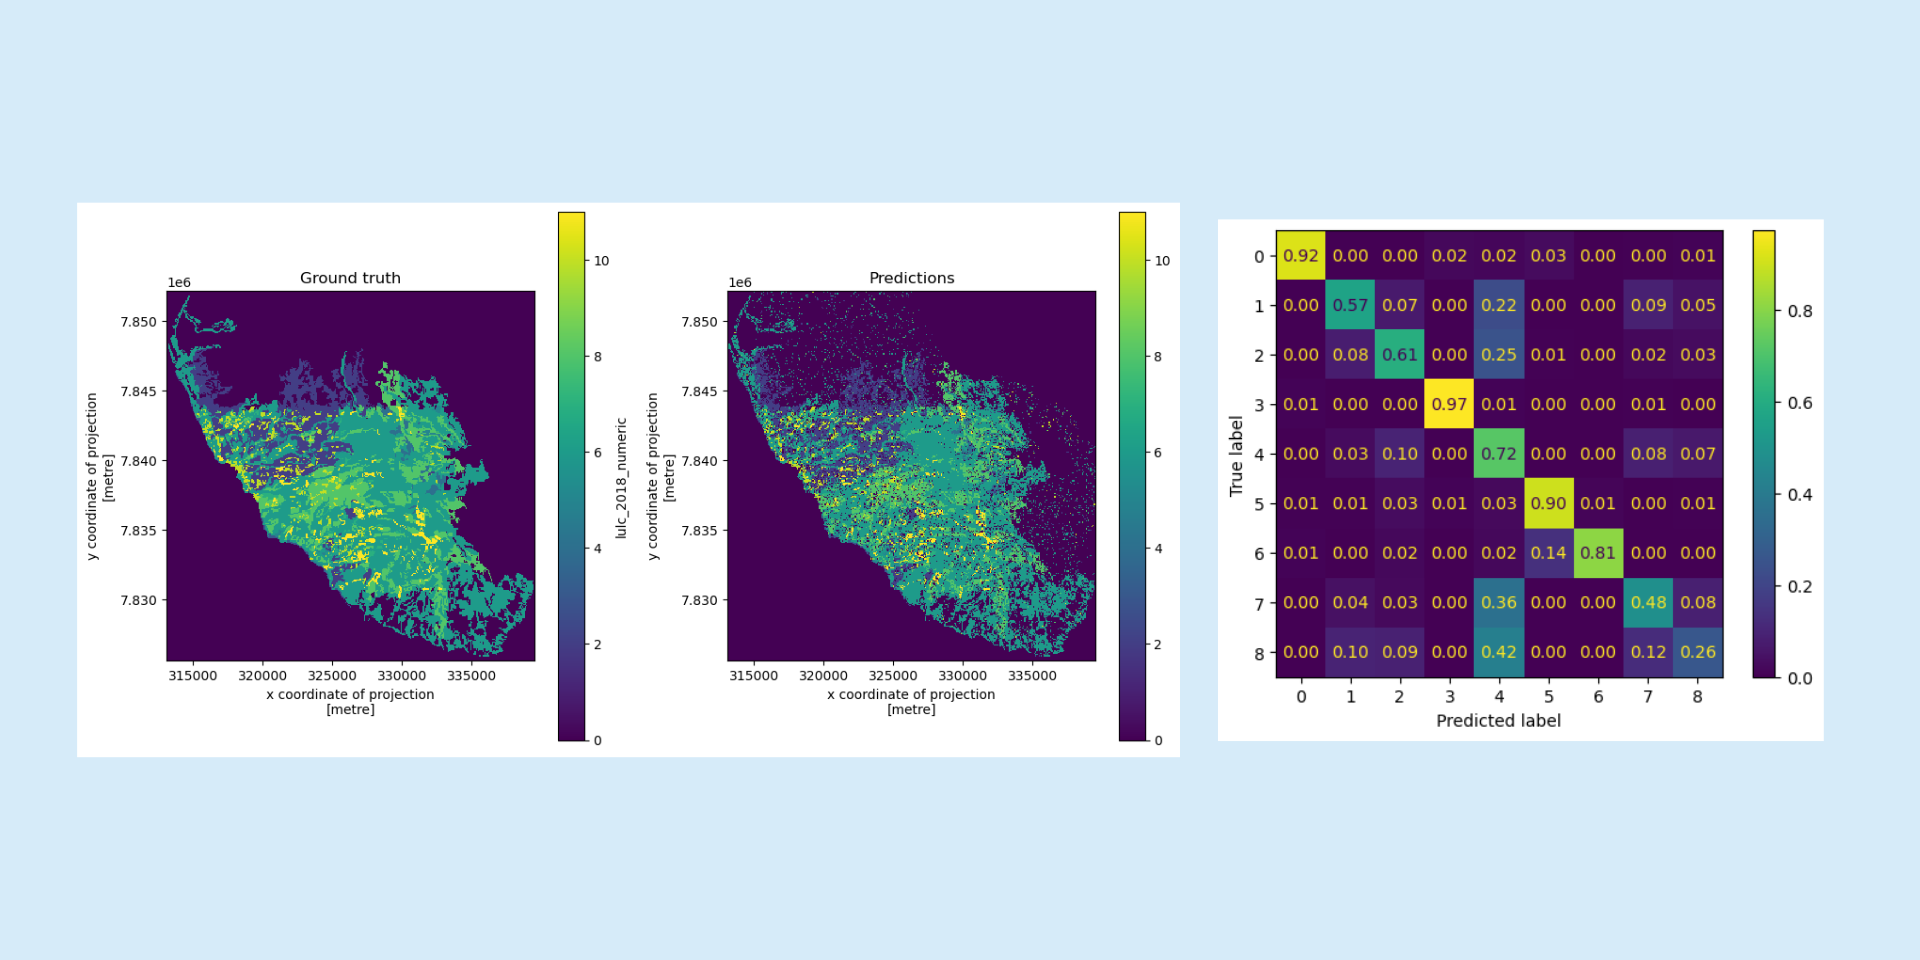
Results from the Random Forest model's predicted land cover types over Tanna, Vanuatu.
Training times were later reduced to seconds by using cuML - a GPU-accelerated Random Forest implementation from NVIDIA. Running inference for the entire country was further simplified by relying on DEP’s GeoMedian composites, which provide virtually cloud-free imagery annually across the South Pacific. At that point, the primary remaining limitation was the availability of ground truth and validation data.
For road network mapping, we relied on established convolutional neural network approaches. Architectures such as UNet were sufficient for the task, and performance was constrained less by model choice than by data availability. Open high-resolution imagery was only available for parts of Vanuatu, including limited coverage from OpenAerialMap, which restricted how far the workflow could be extended.
High-quality labels and data (imagery or LiDAR) matters more than fancy model architectures.
Learning through in-person workshops
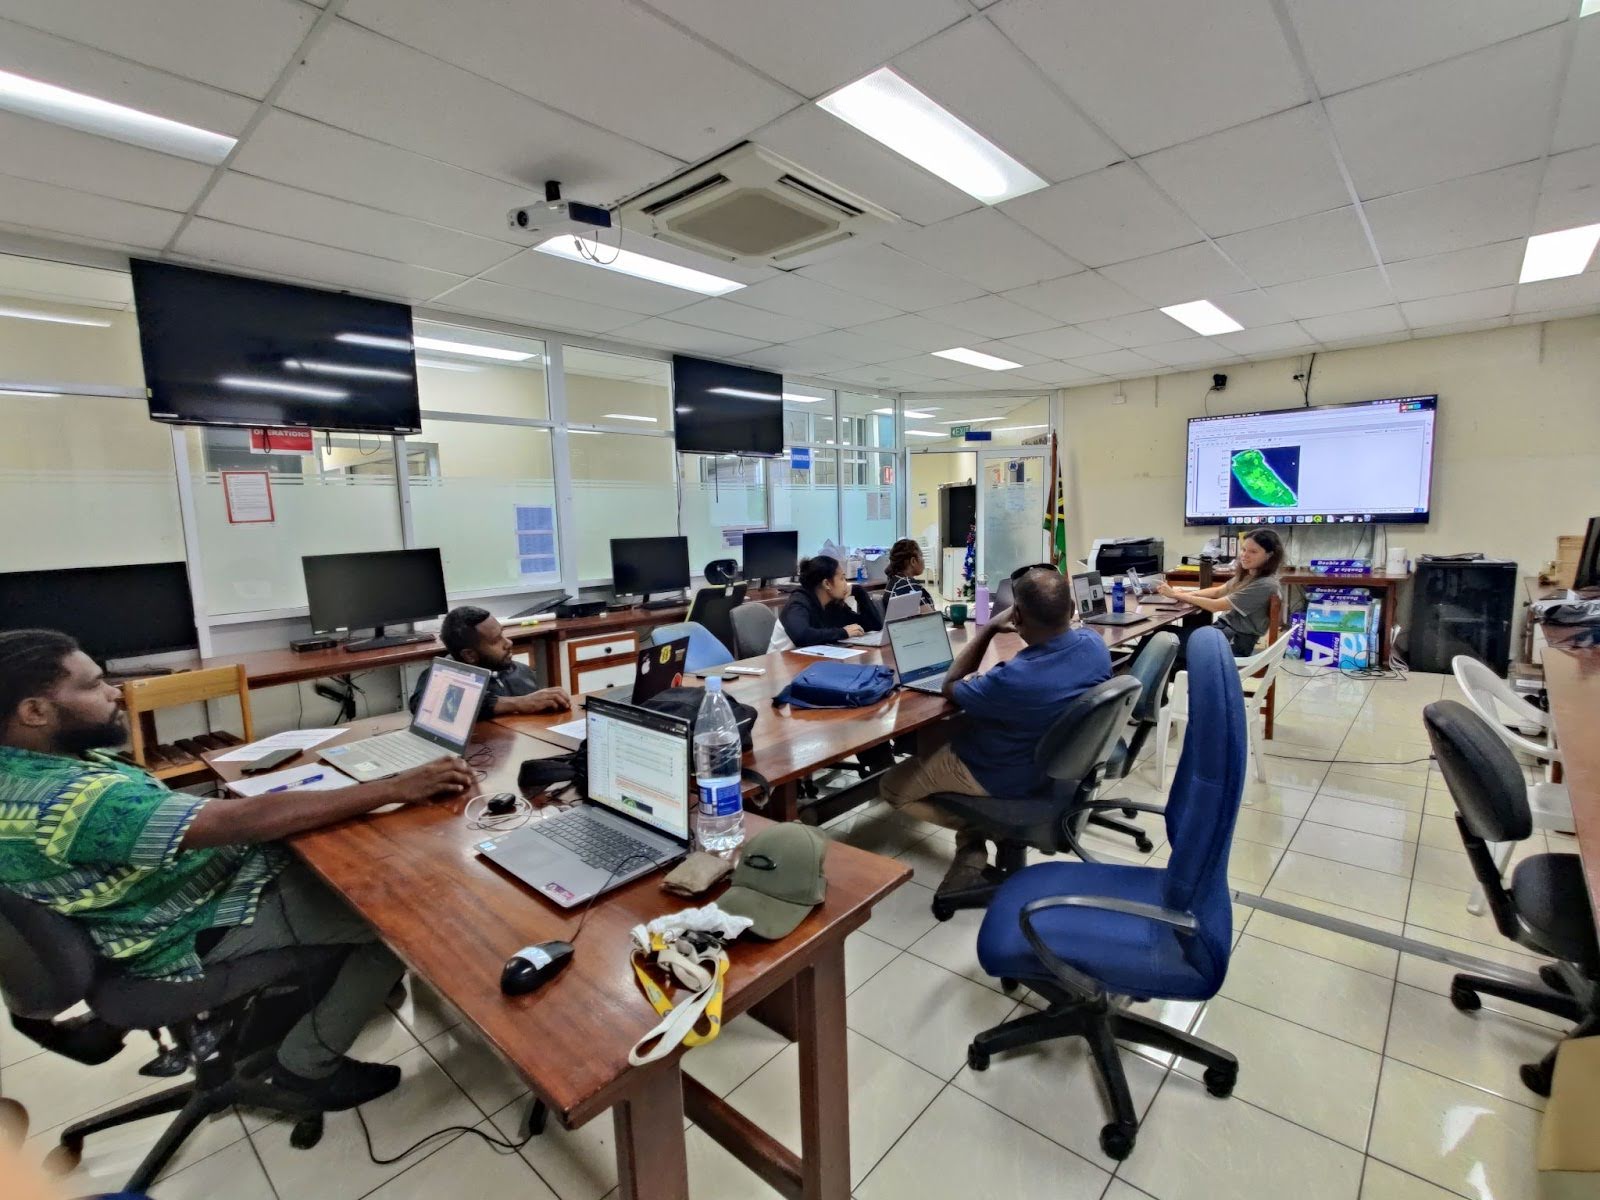
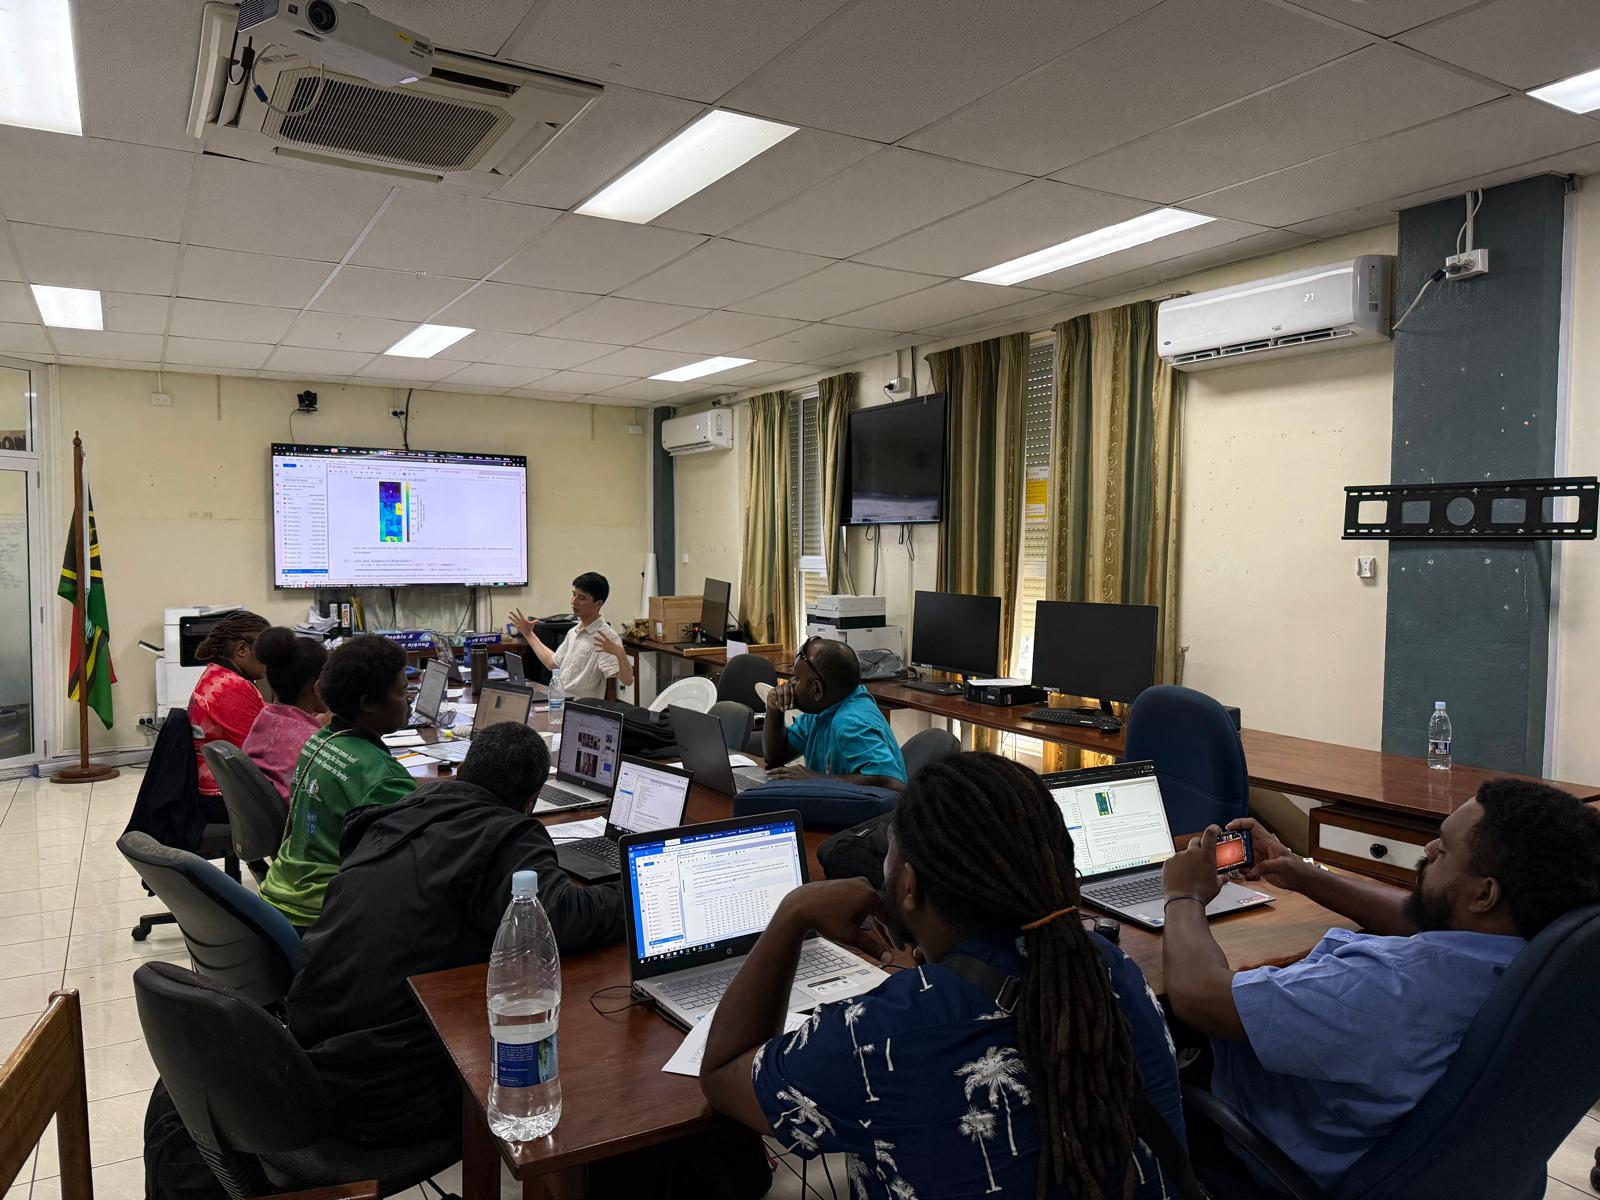
In August 2025, we conducted a workshop at IGARSS in Brisbane before traveling directly to Vanuatu for an in-country training! Our primary workspace for the week (pictured below) was at the National Disaster Management Office (NDMO). Deputy Chief Statistician Charlie told us that this is the same room where the emergency team stays for weeks during tropical cyclone season, a reminder that the work we were doing was tied to immediate, real-world decision-making.
The training covered a wide range of topics, including coastal change analysis using DEP’s Coastlines product; historical and future climate analysis using ERA5 and CMIP6 datasets, with an extra focus on marine heat waves; and mapping of coral reef extent and soil health indicators derived from Sentinel-2 band indices.
None of this would have been possible without access to standardised, analysis-ready data products. Digital Earth Pacific’s public platform provides several regional datasets, and we also relied on downscaled climate data shared by organizations including Climate Impact Lab, NASA NEX and Carbonplan to support time-series climate forecasts at local scales.
The in-person experience helped us to better understand the impact of this work and build stronger relationships with the lovely VBoS staff. In some respects, we learned and 'received' so much more back on how to be happy, recognizing the friendly local culture, drinking kava, and appreciating the fact that good things take time.
Bringing analysis to decision-makers through the MIS
The work does not end in Jupyter Notebooks or QGIS. To support policy and planning, results need to be accessible to non-technical audiences. This is where VBoS’s Management Information System (MIS) plays a central role.
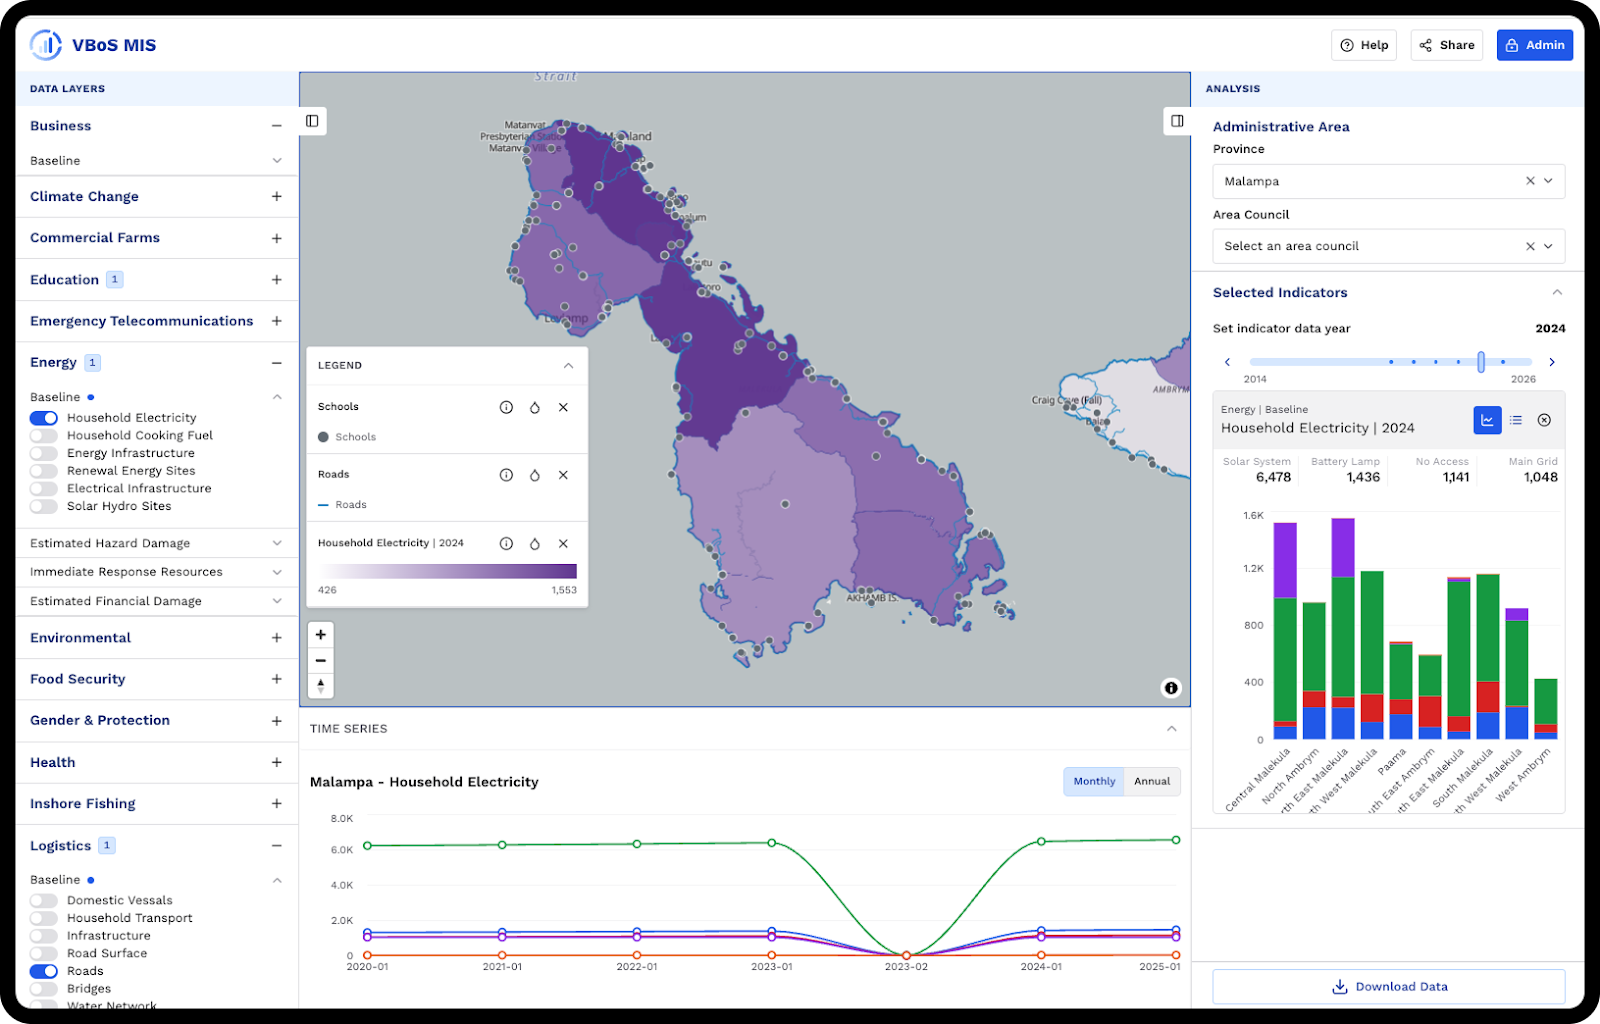
Management Information System dashboard showing Malekula, Vanuatu with household electricity statistics plotted on maps and charts.
We began with a discovery phase to align with the VBoS on user needs, workflows, and visual direction. Through workshops, interviews with government officials, and iterative wireframing, it became clear that the MIS needed to move away from manual, fragmented data workflows toward a centralized, user-friendly platform that could function as a true decision-support tool.
Users in Vanuatu needed a system that could support multiple time horizons: providing predictive insight to help quantify potential loss and damage, enabling immediate disaster response within a 72-hour window, track longer-term climate change impacts and indicators for their National Sustainable Development Plan. Meeting these needs required a platform that could organize, filter, and visualize diverse datasets across sectoral and administrative boundaries, while remaining reliable and straightforward to use across many levels of government.
The MIS provides an interactive dashboard for exploring climate and disaster-related indicators through maps, time series charts, and tables. Users can filter data at the attribute level by geographic region, disaster type, and time period, making it easier to focus on specific events or planning scenarios. The application also supports permanent, shareable links that preserve the state of the dashboard, along with straightforward downloads of selected data layers for further analysis or reporting.
The system is built as a custom frontend connected to Django-based backend that hosts and serves data products. The backend was designed to give the users the possibility to upload any tabular or geospatial (raster and vector) dataset through an administrative interface. That way, the staff can add or update the data themselves and the results will be immediately available in the MIS frontend. We opted for a database modeling that gave us the flexibility to store any geospatial or tabular data. Together, the MIS helps translate technical analyses into forms that support preparedness, mitigation, response and recovery planning.
Good quality climate and environmental data products enables better data-driven policy.
The live application is available at: https://vcdmis.com
Conclusion
Addressing climate change does not require the most complex tools available. In many cases, progress starts with approaches that are simple, robust, and well matched to local conditions. The training materials developed with VBoS rely on established data infrastructure including STAC-based access patterns, analysis-ready cloud-hosted datasets, efficient GPU-accelerated algorithms, generous compute allowances from DEP, and so much more from the open source and open science community.
The Management Information System builds on this foundation by turning processed data and model outputs into forms that are easier for policymakers to interpret and use.
We are grateful to VBoS and the Government of Vanuatu for supporting an open approach that allows this work to be shared, reused, and adapted. We encourage other small island nations in the South Pacific and beyond to build on these materials so they do not need to start from zero.
Part of this work will also be presented as a poster on Tuesday, 10 Feb 2026 at the Climate and Cryosphere Open Science Conference in Wellington, New Zealand. Feel free to contact us if you want to connect!
Acknowledgements
- Hugo Pigott, Susie Mento, Javen Fakalitere Wilfred, Herman Tevilili, Gabriel Baltor, Charlington Leo and others from the Vanuatu Bureau of Statistics.
- Alex Leith from Auspatious/DEP for technical support and generosity on the JupyterHub environment.
- Nick Metherall, Sachindra Singh and Andiswa Mlisa and many others from SPC for informative discussions and their dedication in building capacity in the region.
What we're doing.
Latest