

Getting timely Earth observation (EO) data is hard, even for experts. EO Predictor estimates when and where upcoming observations are likely to occur, helping people find relevant EO data faster.

Earth-observing satellites collect enormous amounts of data every day—well over 100TB. The problem isn’t whether data exists. The problem is whether the right people can find and use it in time for it to matter.
For past observations, this has gotten easier. Standards like STAC, along with tools such as Sentinel Hub and stac-map, make it possible to understand what data exists, where it covers, and how to access it. That groundwork matters.
But many real-world decisions depend just as much on what hasn’t happened yet.
Knowing when and where a satellite is likely to observe next can shape everything from disaster response to planning fieldwork or requesting commercial imagery. That kind of foresight is still surprisingly hard to come by.
EO Predictor focuses on that missing piece: making upcoming observations visible.
Problems for Disaster Responders
Disaster response is one of the clearest places where predicted observations matter.
During and immediately after an event, teams often need to know whether relevant imagery will be available soon, whether new observations can be tasked, and which sensor types are likely to work given conditions on the ground.
For example, when a typhoon is approaching a coastal city, responders may want to identify upcoming SAR observations that won’t be blocked by cloud cover, or determine which satellite operators are positioned to collect imagery shortly after landfall. Having that information early can change what actions are possible.
EO Predictor shows potential upcoming observations in a straightforward, intuitive way, whether in the office or on the way to the disaster.
In practice, getting to that point usually requires answering a long list of questions before analysis can even begin:
- When was the last usable observation collected?
- When is the next one likely to occur?
- Which sensor types and resolutions make sense for this situation?
- Is the data freely available, or does it need to be purchased?
- Where can I access the data?
Too often, these questions slow things down. Sometimes they stop the work entirely. This isn’t just a problem for newcomers—recent disasters have shown that even experienced EO practitioners can struggle to access relevant data quickly under pressure.
Simplifying EO Predictions
Try for yourself below, or go directly to EO Predictor.
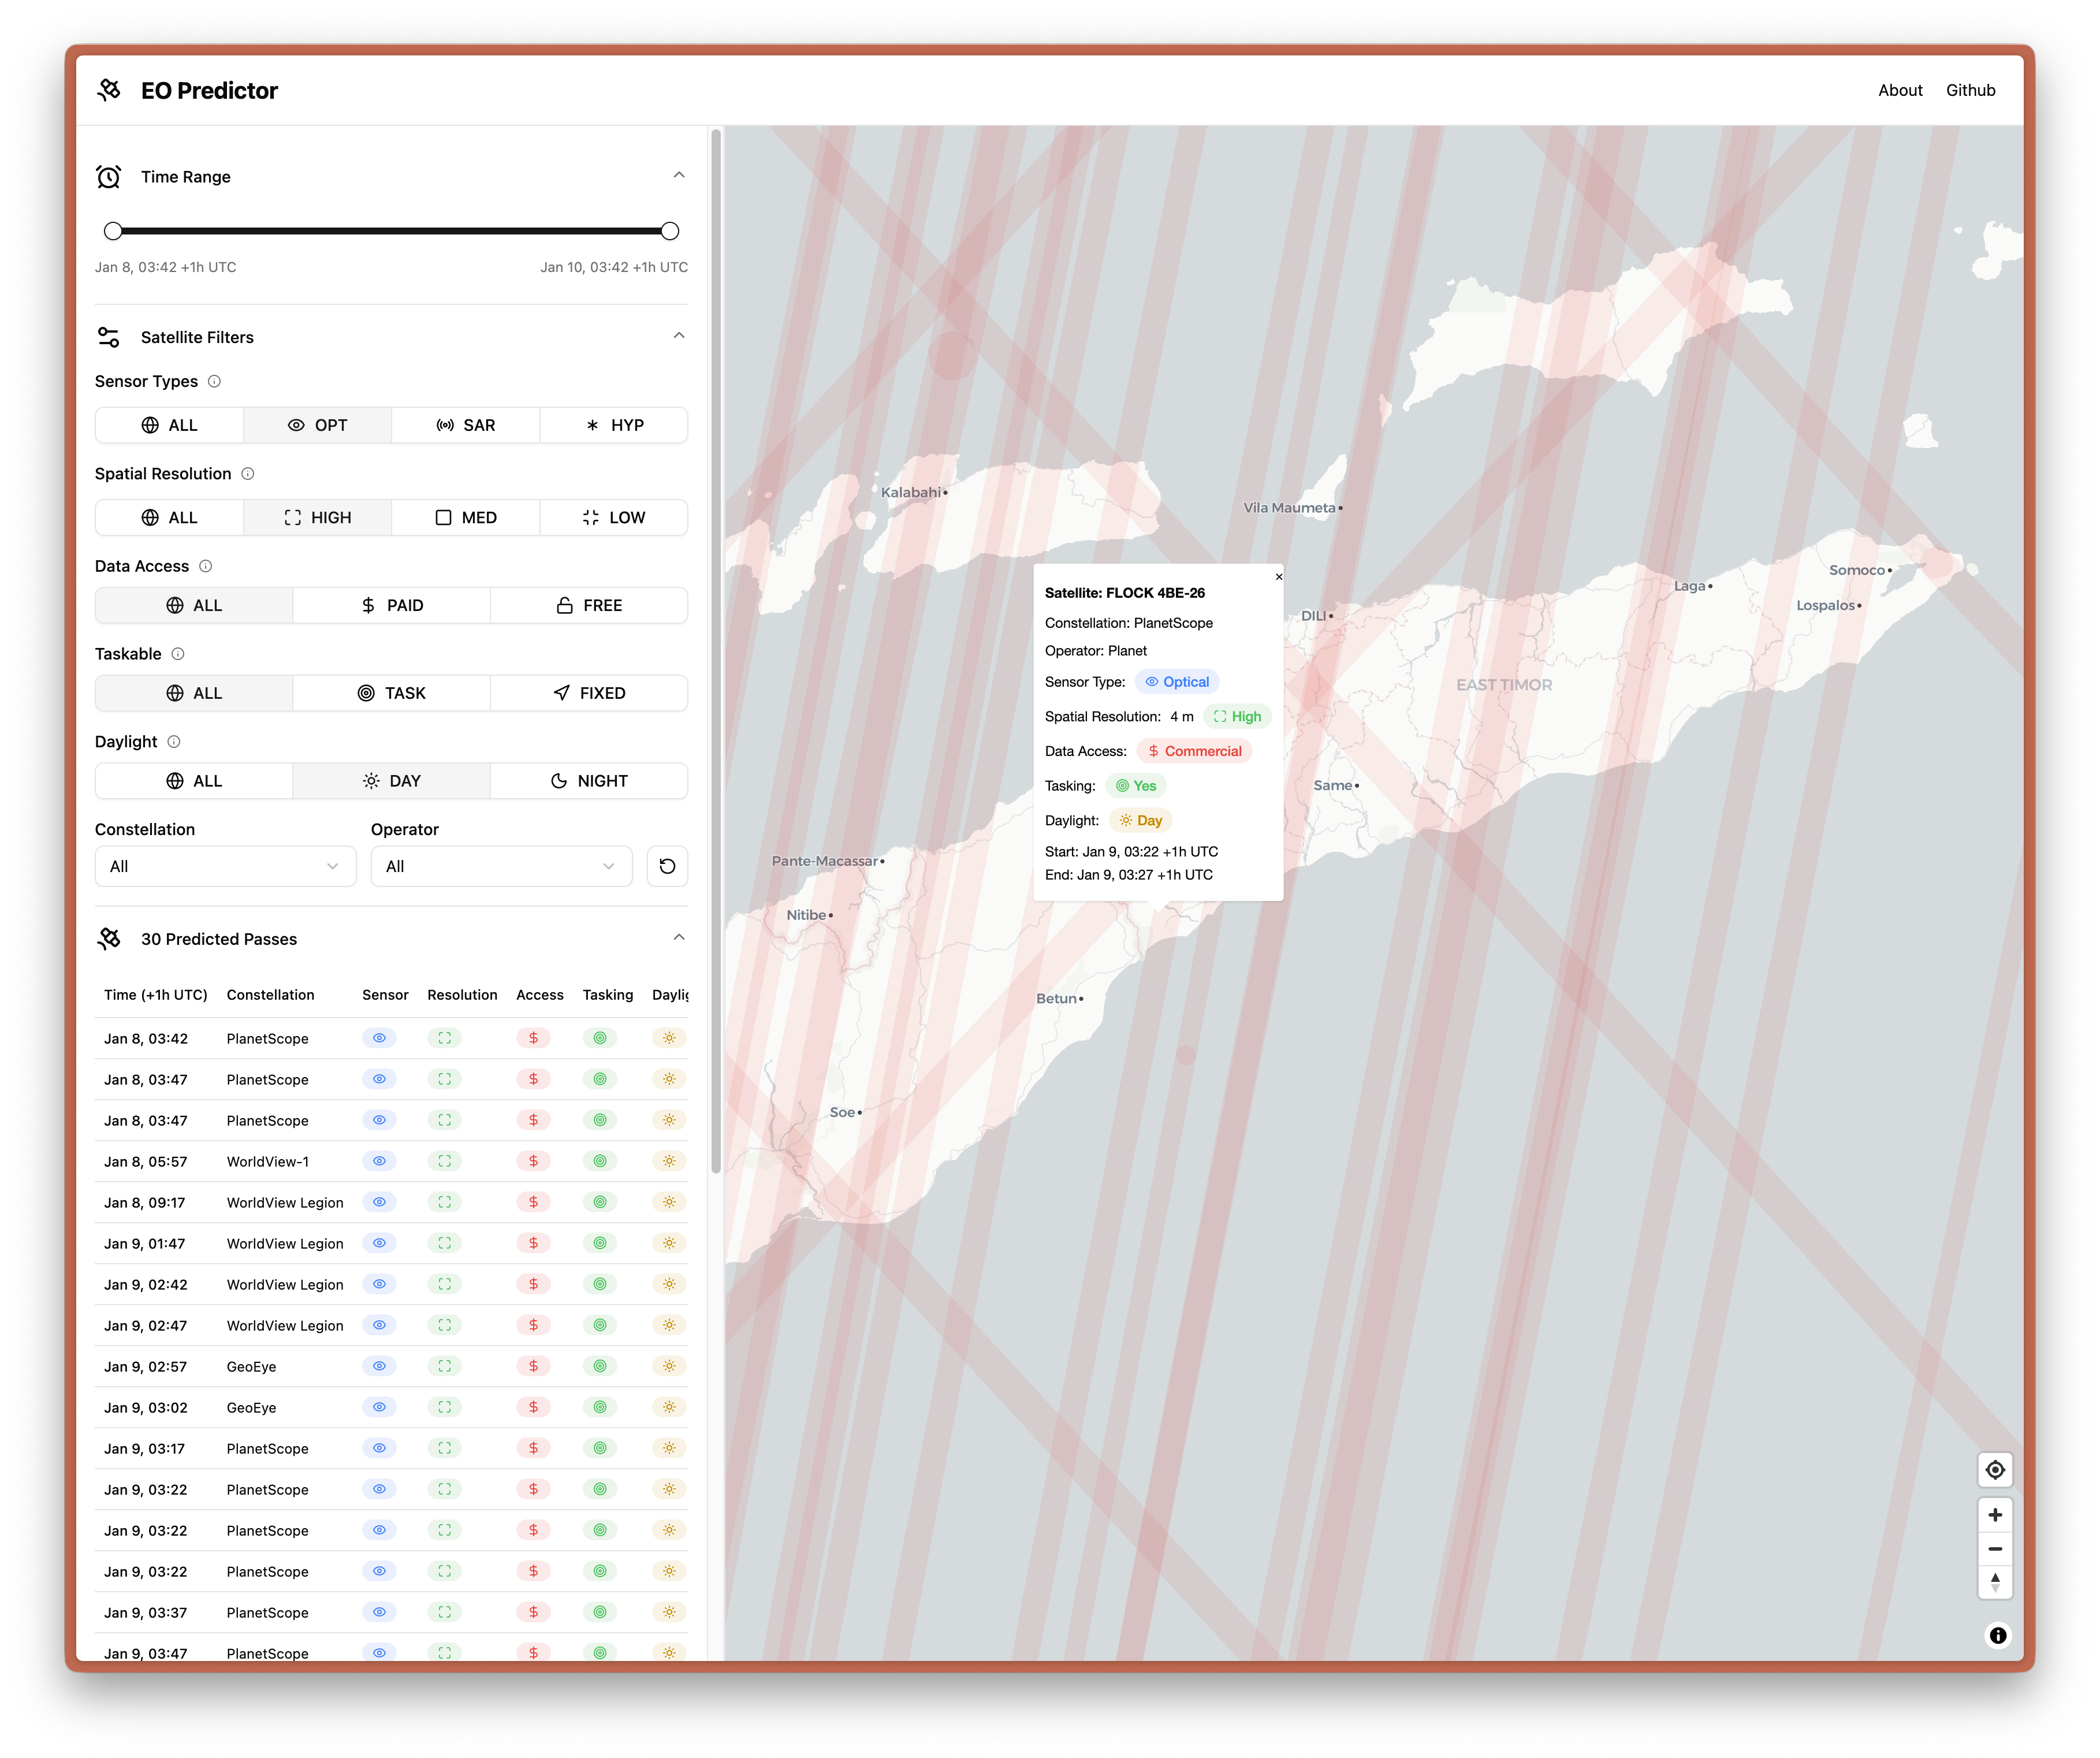
EO Predictor is a map-first tool that helps answer a simple question: where are satellite observations likely to occur in the next 48 hours?
Users start by navigating to an area of interest. From there, they can filter predicted observations based on characteristics that usually matter most:
- Observation timing within the 48-hour window
- Sensor type (optical, SAR, or hyperspectral)
- Spatial resolution
- Whether the data is free or commercial
- Satellite constellation and operator
Matching observations appear directly on the map and in a chronological list.
The interface is intentionally restrained. The goal isn’t to explore everything—it’s to help people quickly narrow in on observations that are plausibly useful for their situation, whether they’re working at a desk or in the field.
How It Works
Behind the scenes, EO Predictor relies on a lightweight, repeatable pipeline.
A set of JSON files, defines the satellite constellations included in the tool. Each satellite’s NORAD ID is used to retrieve general perturbations data from CelesTrak. Using the Skyfield library, satellite positions are calculated at five-minute intervals over a forward-looking 48-hour window.
Those positions are connected into orbital paths. Swath width information is then applied to approximate the area each sensor is likely to observe, producing polygons that represent predicted coverage.
Each polygon carries additional metadata, including sensor type, spatial resolution, constellation membership, and whether the observation is expected to occur during local daylight or nighttime conditions.
The resulting geometries are tiled using Tippecanoe and served as static vector tiles. The entire pipeline runs automatically via GitHub Actions once per day, allowing EO Predictor to be hosted as a static site.
Starting from a global view, users can quickly zoom into their area of
interest and apply filters to match their needs. Here, a user is seen
filtering for optical, high-resolution observations that occur during (local)
daylight hours over Mogadishu, Somalia.
Several observations in
the next 48 hours matches the filtered criteria within the map viewport, with
one observation predicted directly over Mogadishu.
On the frontend, a React application uses MapLibre to render the data on a globe. Filtering happens client-side based on the current map view and selected criteria. To keep performance predictable, results are limited to cases where fewer than 100 observations match.
Limitations
Predictions come with uncertainty, especially when satellites move at orbital speeds and don’t always point straight down.
EO Predictor does not account for off-nadir tasking, operator priorities, or delays between observation and data availability. For that reason, the tool should be treated as a first estimate—not a guarantee that data will be accessible at a specific time or place.
There are also broader ecosystem limits. There is no single place where all future Earth observations are cataloged, and even historical EO data remains fragmented across platforms and providers. Tasked satellites add another layer of complexity: their observations depend on customer requests and can change at short notice.
Finally, EO Predictor does not yet account for cloud cover, which can make optical imagery unusable even when an observation occurs as predicted.
Further Development
We hope that EO Predictor provides value to people who need predictions of upcoming earth observations.
To better understand how EO data is currently being used in the humanitarian and disaster response sectors, we’d like to get feedback in order to improve this product.
We’d also like to address some of the limitations discussed, including:
- Linking predicted observations to STAC data catalogs for continuously operating satellites, or to tasking platforms for satellites that support on-demand imaging
- Adding clearer explanations of filter options and providing suggested presets for common use cases
- Incorporating predicted cloud cover data and filterability for predicted observations.
The current list of satellites represents only a small portion of the data collected every day. We’ve made it relatively easy to add more satellites to the supported list, and encourage users to do so.
EO Predictor doesn’t solve access to Earth observation data on its own. But it makes one part of the problem—anticipating when and where observations are likely to happen—easier to work with. We'll be at Humanitarian Networks and Partnerships Weeks (HPNW) this March in Geneva, reach out if you'd like to connect with us there!
What we're doing.
Latest