

During my summer internship at Development Seed, I set out to explore ESA’s new Zarr format for Sentinel-1 data. I wanted to understand what it means for real-world analysis—so I built a workflow to monitor the 2024 Valencia floods. Along the way, I learned how cloud-native tools can make time series SAR analysis more accessible and flexible.

I started my summer internship at Development Seed, working on the EOPF toolkit project. From an outside perspective, I wanted to demonstrate how to use, work, and play with the Sentinel-1 data using the new zarr format.
My entry point (and main resource) was EOPF 101. This toolkit facilitates early zarr users (just like me!), helping navigate through and understand this cloud-based format.
To put everything I learned into practice, I created three notebooks focused on Sentinel-1 GRD Zarr data:
- An introduction to exploring Sentinel-1 GRD Zarr data
- Examples demonstrating basic operations with Sentinel-1 GRD Zarr data
- A use case centered on monitoring the 2024 Valencia floods. I’ll get to that in a moment!
Why Zarr Matters
The Zarr format is cloud-native, chunked, compressed, and organized in n-dimension arrays. But... what does this really mean?
Instead of downloading and organizing huge datasets, we can store very large datasets and access only the relevant data we need. Using the Sentinel-1 GRD example: if we only need the measurement group for its variables, why load everything else? We don’t! We manipulate the data access to meet our needs.
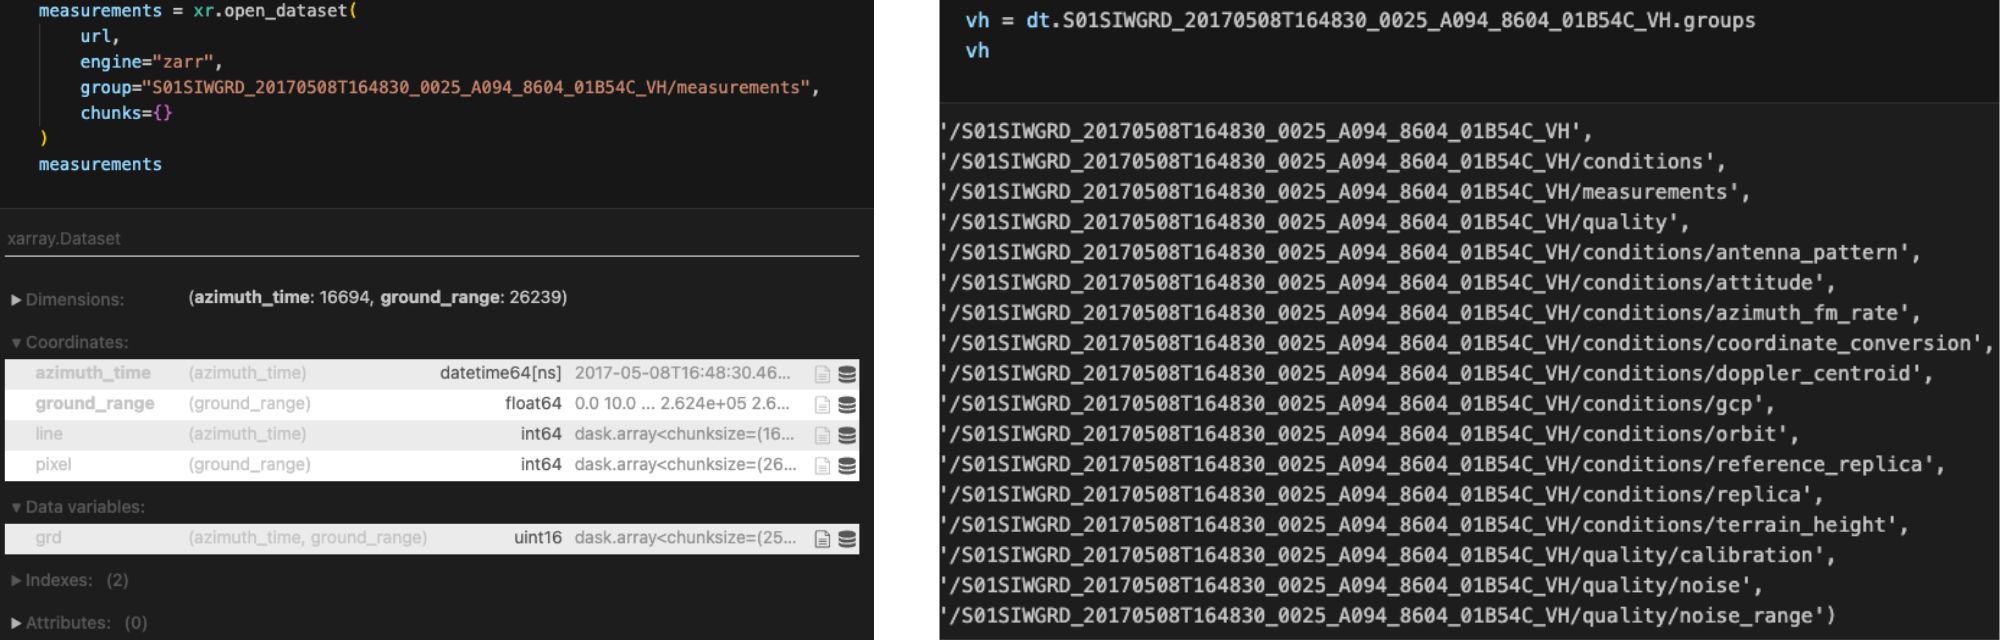
This on the left, rather than loading all these, on the right.
A good strategy for Sentinel-1 GRD flood monitoring is time series analysis. Since this requires large amounts of repeated data, Zarr helps by eliminating the need to download and manage files. It lets us load only what we want and access just the variables we need.
Applying Zarr to Valencia Floods
With the little I knew about Zarr, I applied it to a real case study: the massive 2024 Valencia floods. In September 2024, days of heavy rain across eastern Spain caused rivers to overflow, inundating neighborhoods, destroying crops, and forcing thousands of evacuations. Valencia was one of the hardest-hit regions, and floodwaters lingered for days — making it a strong example of why timely monitoring matters.
To analyze the event, I worked with 14 Sentinel-1 GRD acquisitions covering the before, during, and after of the flooding. Normally, this would have meant downloading and managing 14 bulky SAFE files. With Zarr, I skipped the downloads and worked directly with cloud-hosted arrays.
Using xarray and xarray-sentinel, I built a time series that let me compare intensity backscatter across dates. xarray’s lazy loading capability ensures that only the necessary data is loaded into memory. The actual computation only happens when we explicitly request results, like plotting or interpolating coordinates. The differences between scenes highlight where water spread across the landscape: dark areas represent low backscatter from smooth water surfaces, while higher values indicate urban areas, vegetation, or exposed ground. By stacking the datasets along a new time dimension, I could trace how flooded areas expanded and receded over the course of the storm.
This analysis didn’t aim to produce an official flood map, but it showed how Zarr makes it easier for someone like me, new to SAR, to quickly pull together a multi-date workflow and start exploring real-world events. That flexibility is exactly what you want when studying disasters that unfold quickly and require rapid insights.
Because we wanted to run a time series analysis, we stacked the datasets along a new time dimension. We took advantage of the cool zarr and xarray combination. To be fair, this was a challenging part:
- To stack several datasets into a single one, they must share the same dimensions, shapes, and dimension values.
- Sentinel-1 GRD data does not naturally behave this way. It is expectable to have the same dimensions but not the same shape and most definitely not the same dimension values.
- Coregistration is the usual solution for aligning SAR images, but currently no python library supports coregistration of zarr data.
But Zarr is so easy to handle and manipulate that I was able to perform a DIY coregistration using only xarray.
Not all the tools are available yet, and some SAR operations cannot be performed as they were in other SAR applications, such as SNAP (ESA's free platform for analyzing Sentinel data). But with Zarr, the processing was incredibly fast. What would have been slow and heavy in SNAP ran smoothly in a full Python environment. And the best part was that I handled everything in one place without switching software.
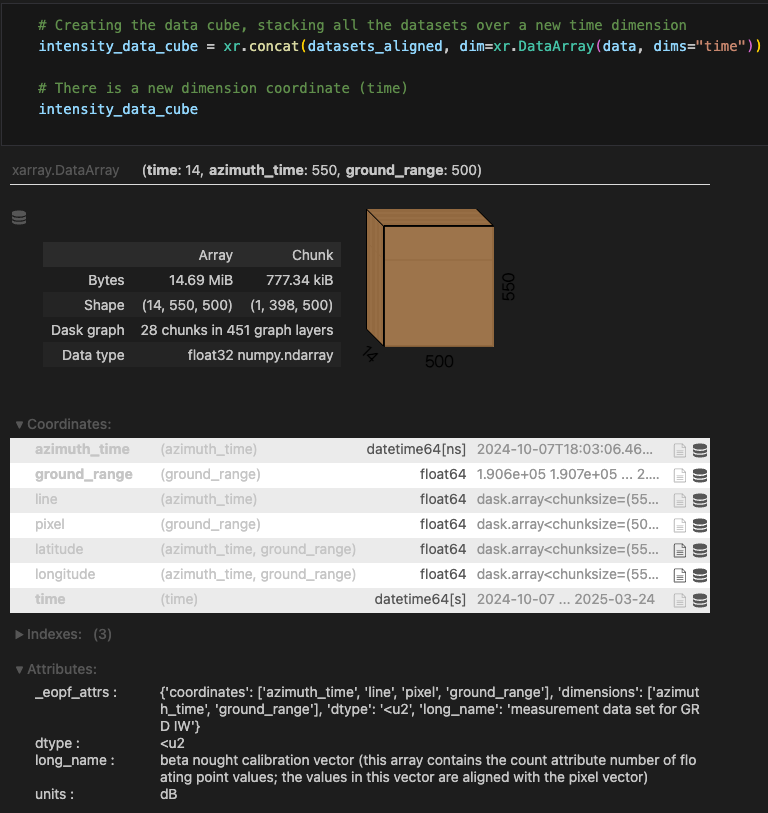
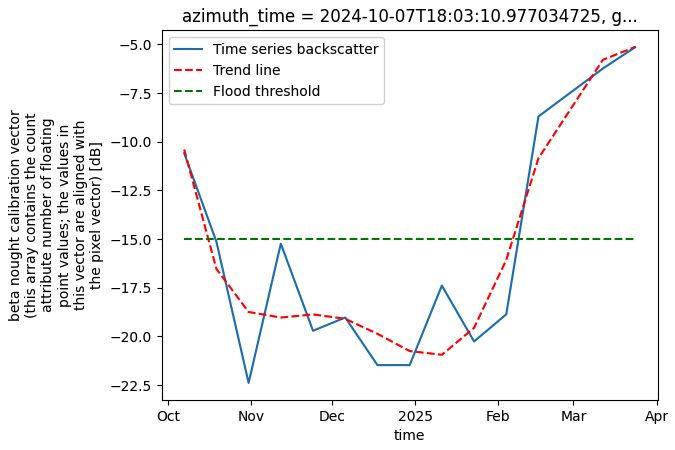
Creating a time-series data cube from Sentinel-1 SAR backscatter measurements. The chart shows backscatter values over time with a trend line and a flood threshold marker.
Current Challenges and Workarounds
There are still challenges with Sentinel-1 Zarr.
For Sentinel-1 GRD data, most datasets are not (yet!) available in the STAC catalog where .SAFE data is converted to Zarr. But they will be! Currently, this limitation makes it harder to work with or manage Sentinel-1 data. For last-minute needs, there are two useful options:
- Requesting specific data with an EOPF sample data request.
- Convert the data yourself, which is not that hard (trust me!).
There are only a few Python libraries that handle SAR operations for Zarr-based data. Within these small groups, the available operations are limited. However, intensity backscatter computation is possible, which has already solved many challenges in my flood mapping workflow.
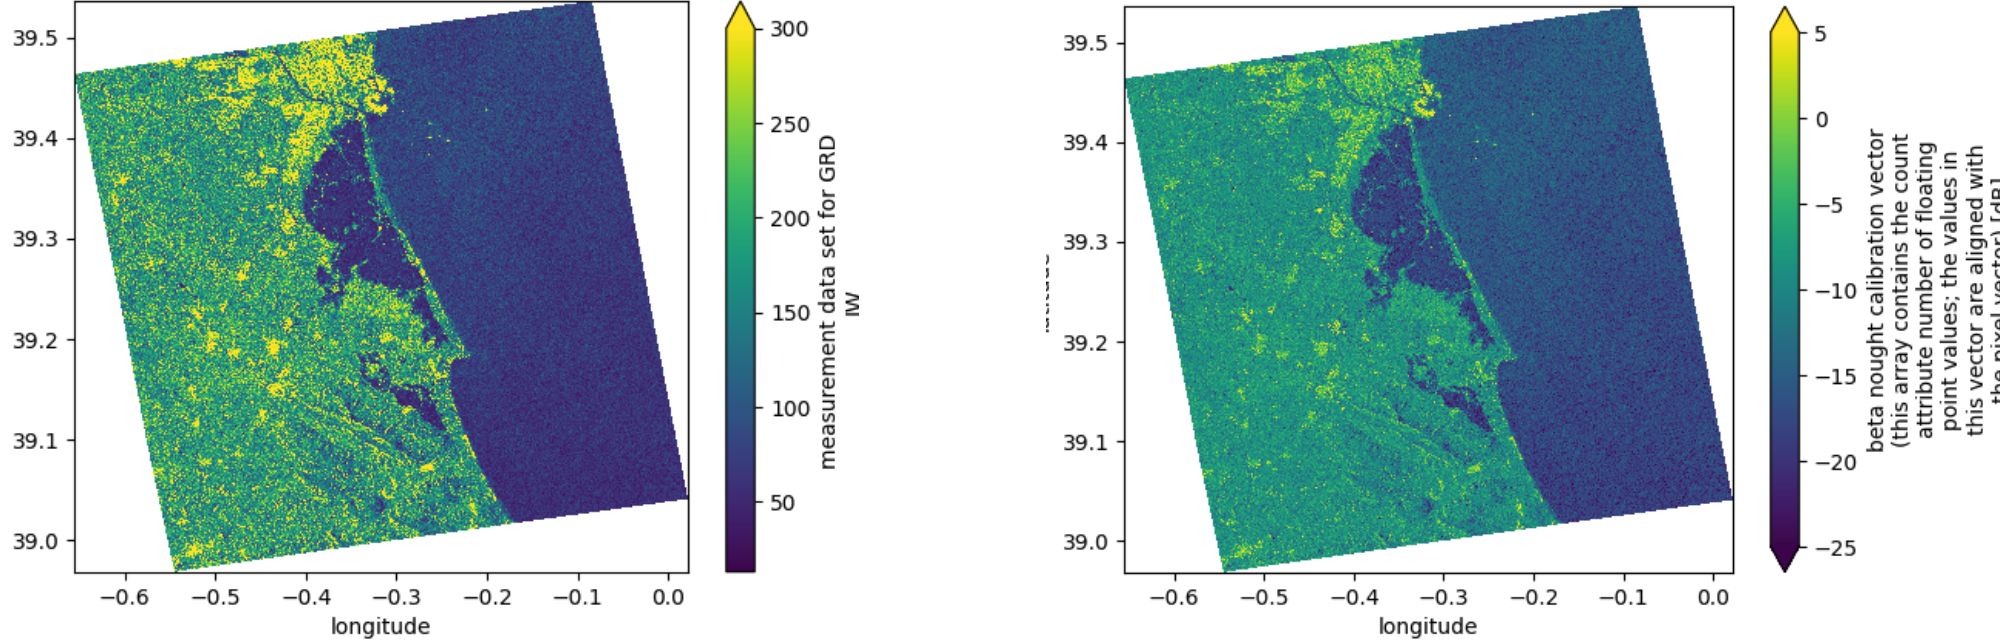
Raw values (left) vs intensity backscatter (right).
Looking Ahead
We don’t have all the necessary tools yet. Some SAR operations over Sentinel-1 data are not possible. But the path that Zarr is forging has already shaken the Copernicus Sentinel world and there's no going back!
Libraries like sarsen are already enabling steps toward a fully cloud-native, Python-based SAR processing workflow. The open source community is gradually recreating complex SAR operations that once seemed possible only in applications like SNAP. And this is great news!
As an Earth Observation and Geo-Data Science student, discovering and learning about Zarr and its capabilities was incredibly valuable. I started as one of the EOPF 101 users and, step by step, came to understand the positive impact that Sentinel Zarr conversion will have from now on. Above all, it is exciting to realize that these changes were motivated, driven, and developed by the open-source community. And anyone can be a part of it! The next big contributions on cloud-native SAR processing workflows might come from me, you, or any other EOPF 101 user.
Want to create your own use cases with the new Zarr data? Join our notebook competition, starting in October.
Farewell lunch with Beatriz and the Lisbon team at the conclusion of her internship.
What we're doing.
Latest