

Directional markers hint at the existence of points of interest beyond what is visible on the map, guiding the user and making the process of exploration more intuitive.

When users navigate digital maps, they often lose sight of important points of interest beyond the visible area. This challenge, known as the "desert fog" problem, can lead to disorientation and missed information. Our solution? Directional markers - a seemingly simple UI element requiring intricate trigonometry and clever CSS manipulation.
We're currently preparing for SatSummit, a conference we've hosted for nearly ten years, bringing together satellite industry leaders and global development experts. The upcoming edition in Lisbon, Portugal, presented a unique challenge: showing points of interest on a map for an area not exactly in Lisbon proper that attendees may be less familiar. The problem? Markers only become visible when users zoom out, which they might not realize they need to do.
Our solution uses directional markers to indicate off-screen points of interest, allowing users to explore the map while zoomed in without losing their bearings.
We'll walk you through our implementation using the SatSummit map as an example, but the techniques are applicable to any interactive mapping project with off-screen points of interest. You'll learn about:
- Calculating marker positions mathematically
- Using CSS transforms for placement and rotation
- Ensuring smooth performance across map states
Whether you're a front-end developer, UX designer, or just curious about applied trigonometry in web development, we hope this provides some practical tips for solving this common digital cartography problem.
Positioning logic
Calculating the marker's position was achieved with some good old trigonometry and then positioned on the map using CSS transforms. We'll break it down step by step.
We're using mapbox-gl to power the map and turf.js for some geospatial calculations, but these principles can be applied with any mapping library.
We only want to consider points that are not visible on the map, so on every move event we check if the point is within the viewport.
// import { point } from '@turf/helpers';
// import { booleanPointInPolygon } from '@turf/boolean-point-in-polygon';
// import { bboxPolygon } from '@turf/bbox-polygon';

mbMap.on('move', () => {
  const bbox = mbMap.getBounds()!.toArray().flat() as BBox;
  const polygon = bboxPolygon(bbox);
  const inViewport = booleanPointInPolygon(point(poiCoordinates), polygon);

  if (!inViewport) {
    // Position the direction marker.
  } else {
    // Hide the direction marker.
  }
});
The second step is to calculate the bearing between the point of interest and the center of the map. The bearing varies from -180 to 180 degrees, with 0 degrees being north, 90 degrees east, -90 degrees west and 180/-180 degrees south.
// import { bearing } from '@turf/bearing';
// import { point } from '@turf/helpers';

const { lng, lat } = mbMap.getCenter();
const br = bearing([lng, lat], point(poiCoordinates));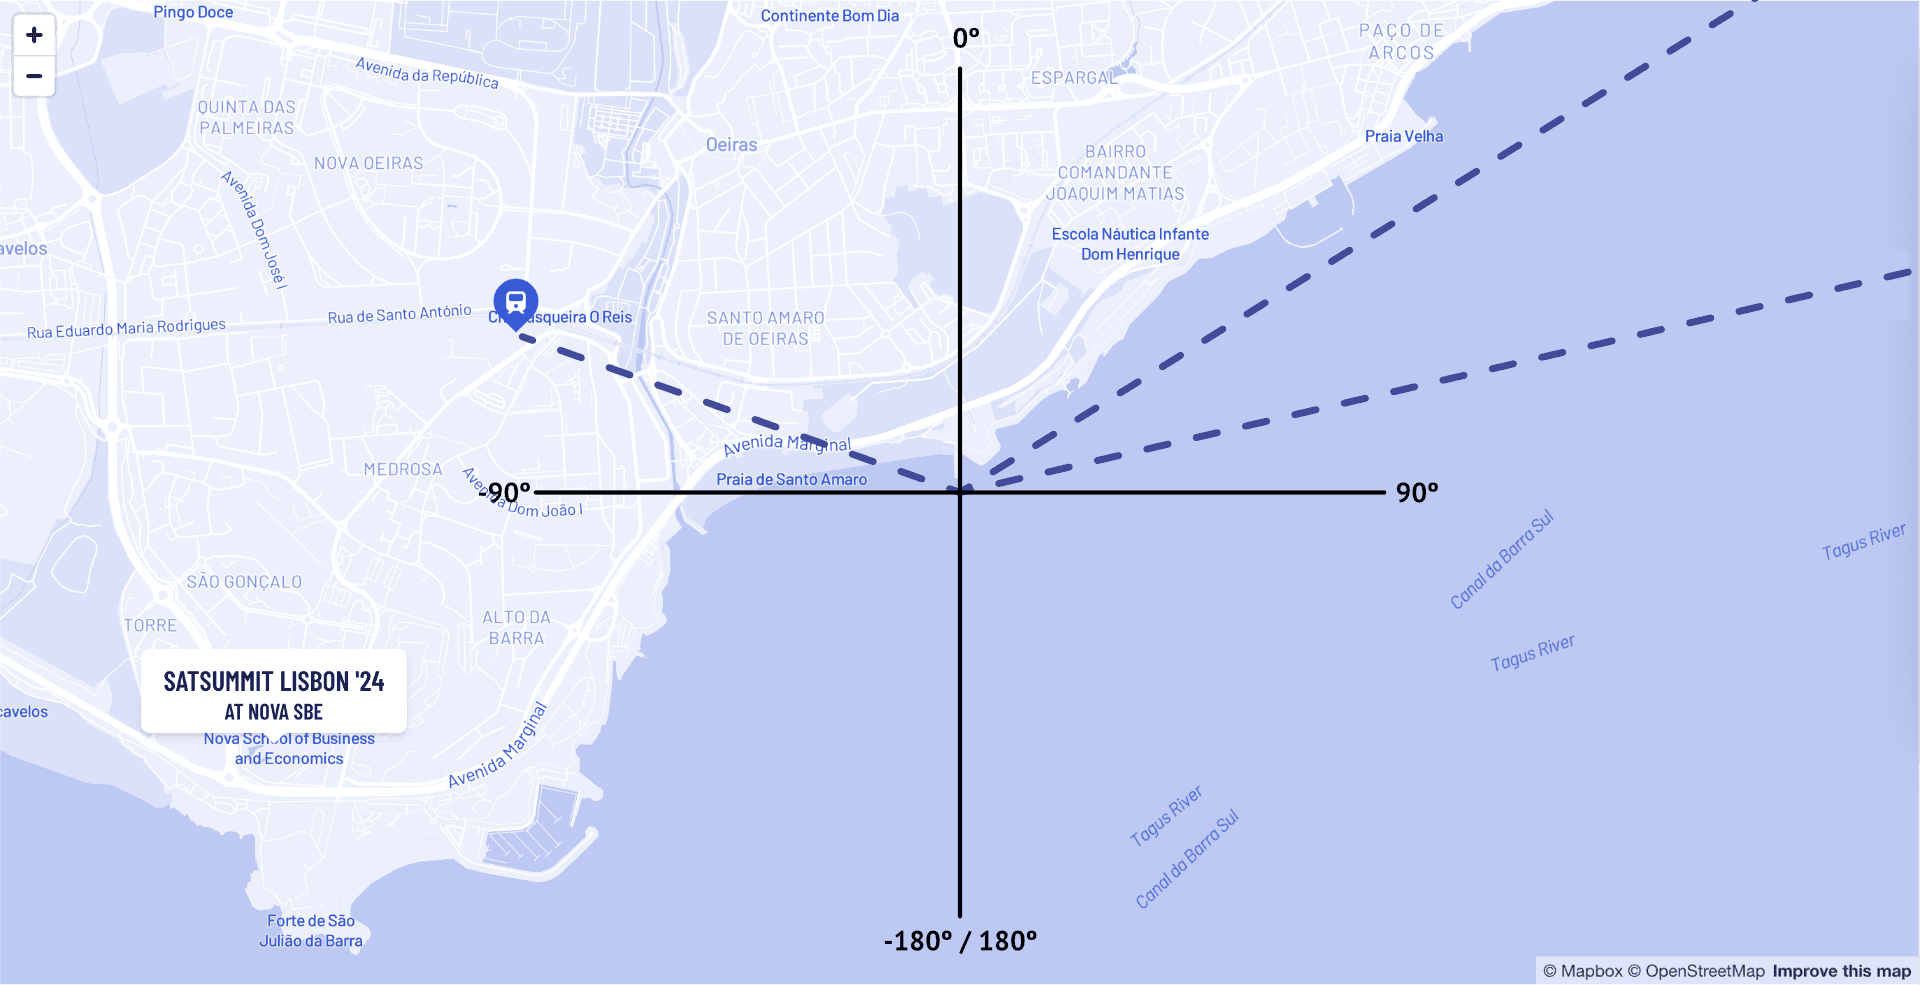
Since we're going to be working with trigonometry and triangles it is easier if all our angles are in the NE quadrant (0 - 90 deg). Later we'll invert the values depending on the original bearing.
We do this by folding the x and y axis. We fold the axis by ensuring that the angle is the same on both sides of the folding axis.
Folding the y axis is just a matter of getting the absolute value of the bearing. In the animation, the solid orange angle is the bearing and the dashed purple angle is the folded angle.
Folding the x axis is a bit more complicated. Looking at the animation, the
dotted green angle must be the same as the dashed purple angle. We can
achieve that with the formula 90 - (bearing - 90) where the bearing is the
solid orange angle.
// Bring the bearing to the north east quadrant.
const absoluteBearing = Math.abs(br);
const isNorth = absoluteBearing <= 90;
const isEast = br >= 0; // Needed to invert the x axis later.

const angle = isNorth ? absoluteBearing : 90 - (absoluteBearing - 90);
Now that we have a normalized angle, we can calculate the intersection point of the bearing with the sides of the map, using trigonometry and the relation between the sides of a right triangle - tan(angle) = opposite / adjacent.
Therefore the x coordinate of the intersection point is given by x = tan(angle) * h where h is half the height of the map since we're working on one quadrant.
The y coordinate is given by y = w / tan(angle) where w is half the width of the map.
// const degToRad = (deg) => (deg * Math.PI) / 180;

let x = Math.tan(degToRad(angle)) * h;
let y = w / Math.tan(degToRad(angle));
Animation of the triangles whose sides (dotted) we have to calculate. The x
value is given by the orange triangle and the y value is given by the purple
triangle.
As shown on the animation above the intersection point may be outside the map boundaries, therefore we have to clamp the values of x and y to the width and height of the map.
Once we clamp the values, the width and height may vary at will and our point will always be in the correct position.
Now that we have the coordinates we need on invert them according to the original bearing. The x is positive on the east and negative on the west and the y is negative on the north and positive on the south. The y is inverted because the y axis is inverted on the screen.
| W | E | |
|---|---|---|
| N | -x -y | +x -y |
| S | -x +y | +x +y |
x = isEast ? x : -x;
y = isNorth ? -y : y;
The last thing to do is calculate the final coordinates of the direction marker. We do this by adding, to the center of the map, the value of the intersection point accounting for any padding we may want have.
For example:
// const clamp = (value, min, max) => Math.max(min, Math.min(max, value));

const markerX = clamp(w + x, padding, w * 2 - padding);
const markerY = clamp(h + y, padding, h * 2 - padding);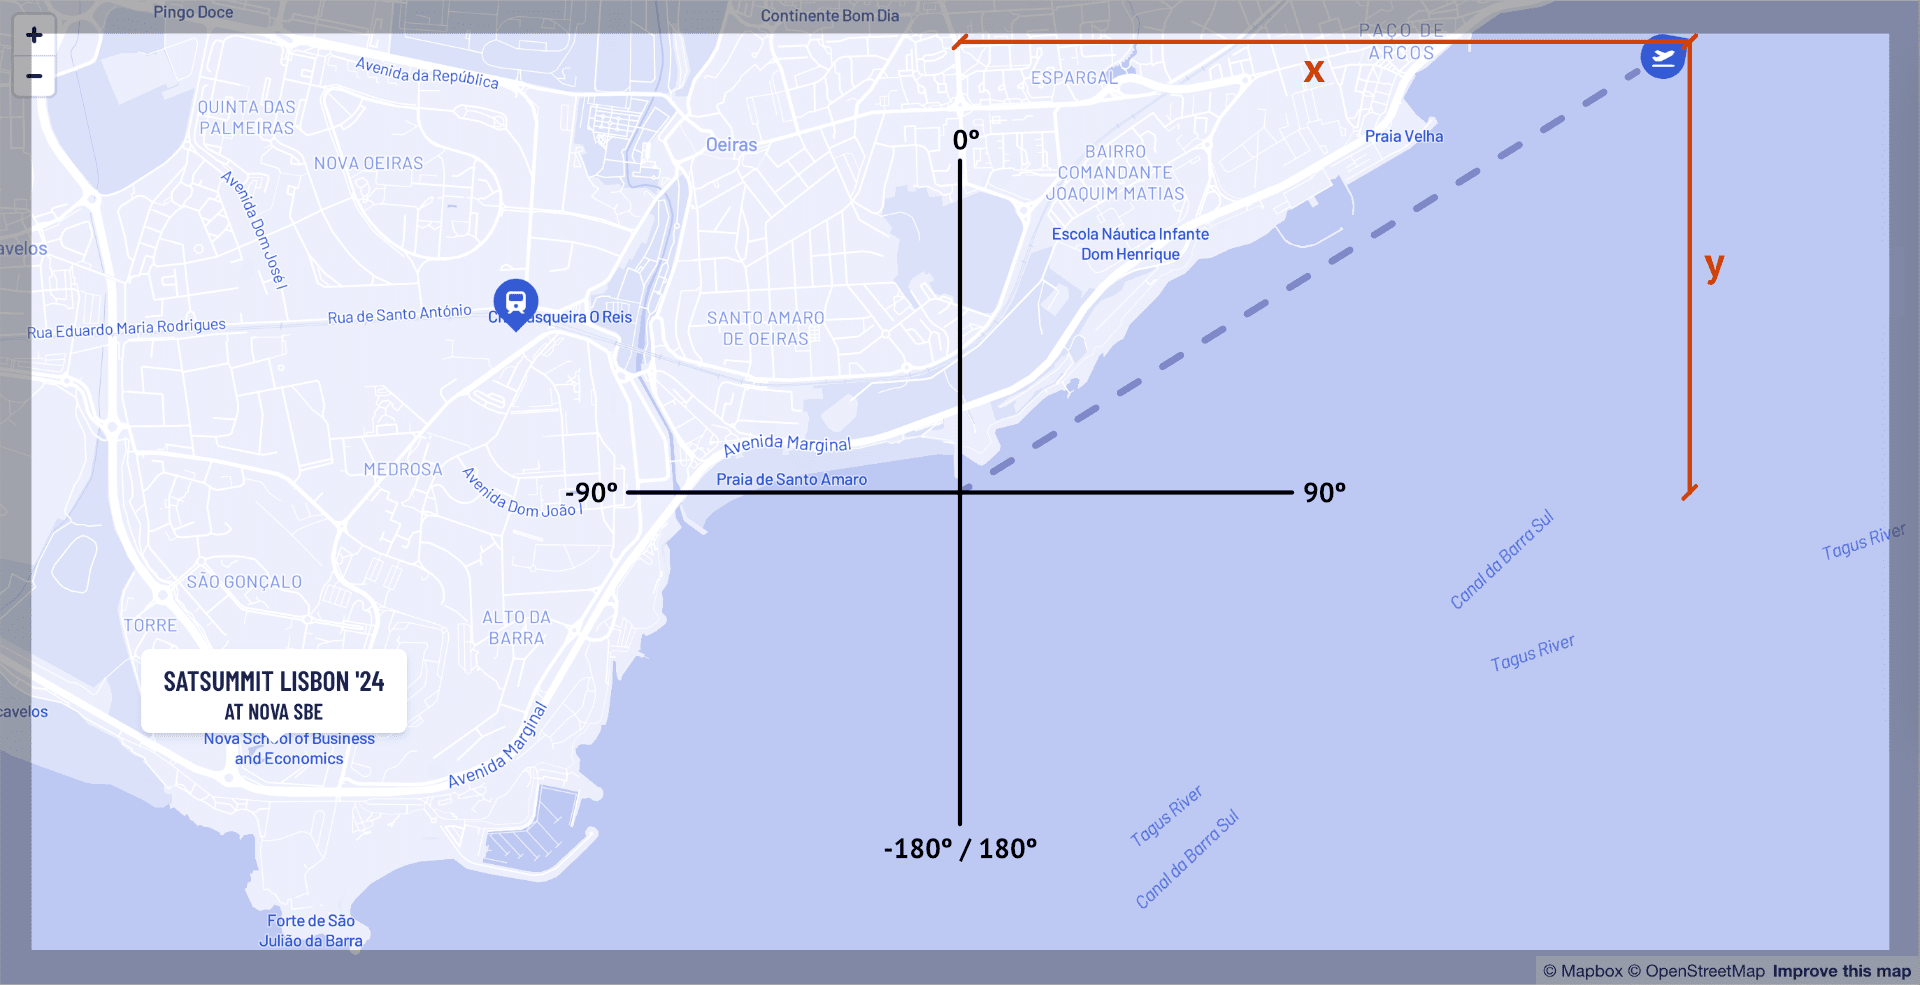
The marker element
With the coordinates calculated we can create the marker and position it on the map.
Creating the square markers is pretty simple. We start with a square div, and round all the corners except the top left one. We then rotate this square div by 45° (to ensure the corner points north), plus the bearing to point at our point of interest.
Inside the square div, we add another div with the content (an icon in this case), to which we apply the inverse rotation to keep it upright.

Steps of the marker construction as detailed above
The last thing to do is add the x and y translation to the marker and ensuring that the map and marker container has position: relative to make the positioning work.
function IconMarker(props) {
  const { angle, x, y, inViewport, children } = props;

  return (
    <div
      style={{
        position: 'absolute',
        zIndex: 100,
        background: 'blue',
        width: '2rem',
        height: '2rem',
        borderRadius: '999px',
        borderTopLeftRadius: 0,
        display: inViewport ? 'none' : 'flex',
        alignItems: 'center',
        justifyContent: 'center',
        transform: `translate(${x}px, ${y}px) rotate(${angle + 45}deg)`
      }}
    >
      <div transform={`rotate(${-angle - 45}deg)`}>{children}</div>
    </div>
  );
}
Join us at SatSummit
Implementing directional markers for off-screen points of interest enhances user experience and solves a common challenge in digital cartography. By leveraging trigonometry and CSS transforms, we've created an intuitive solution that guides users through complex map interfaces. While we've applied this technique to the SatSummit map, these principles can be adapted to various mapping projects.
Speaking of SatSummit, we'd love to see you there! Join us on November 18 and 19, 2024 in Lisbon, Portugal, to explore how satellite data can address critical global challenges. Register now to be part of this exciting confluence of technology and development. Who knows? You might even get to test our directional markers in person!
Have a sticky map application challenge? We'd love to help.
What we're doing.
Latest