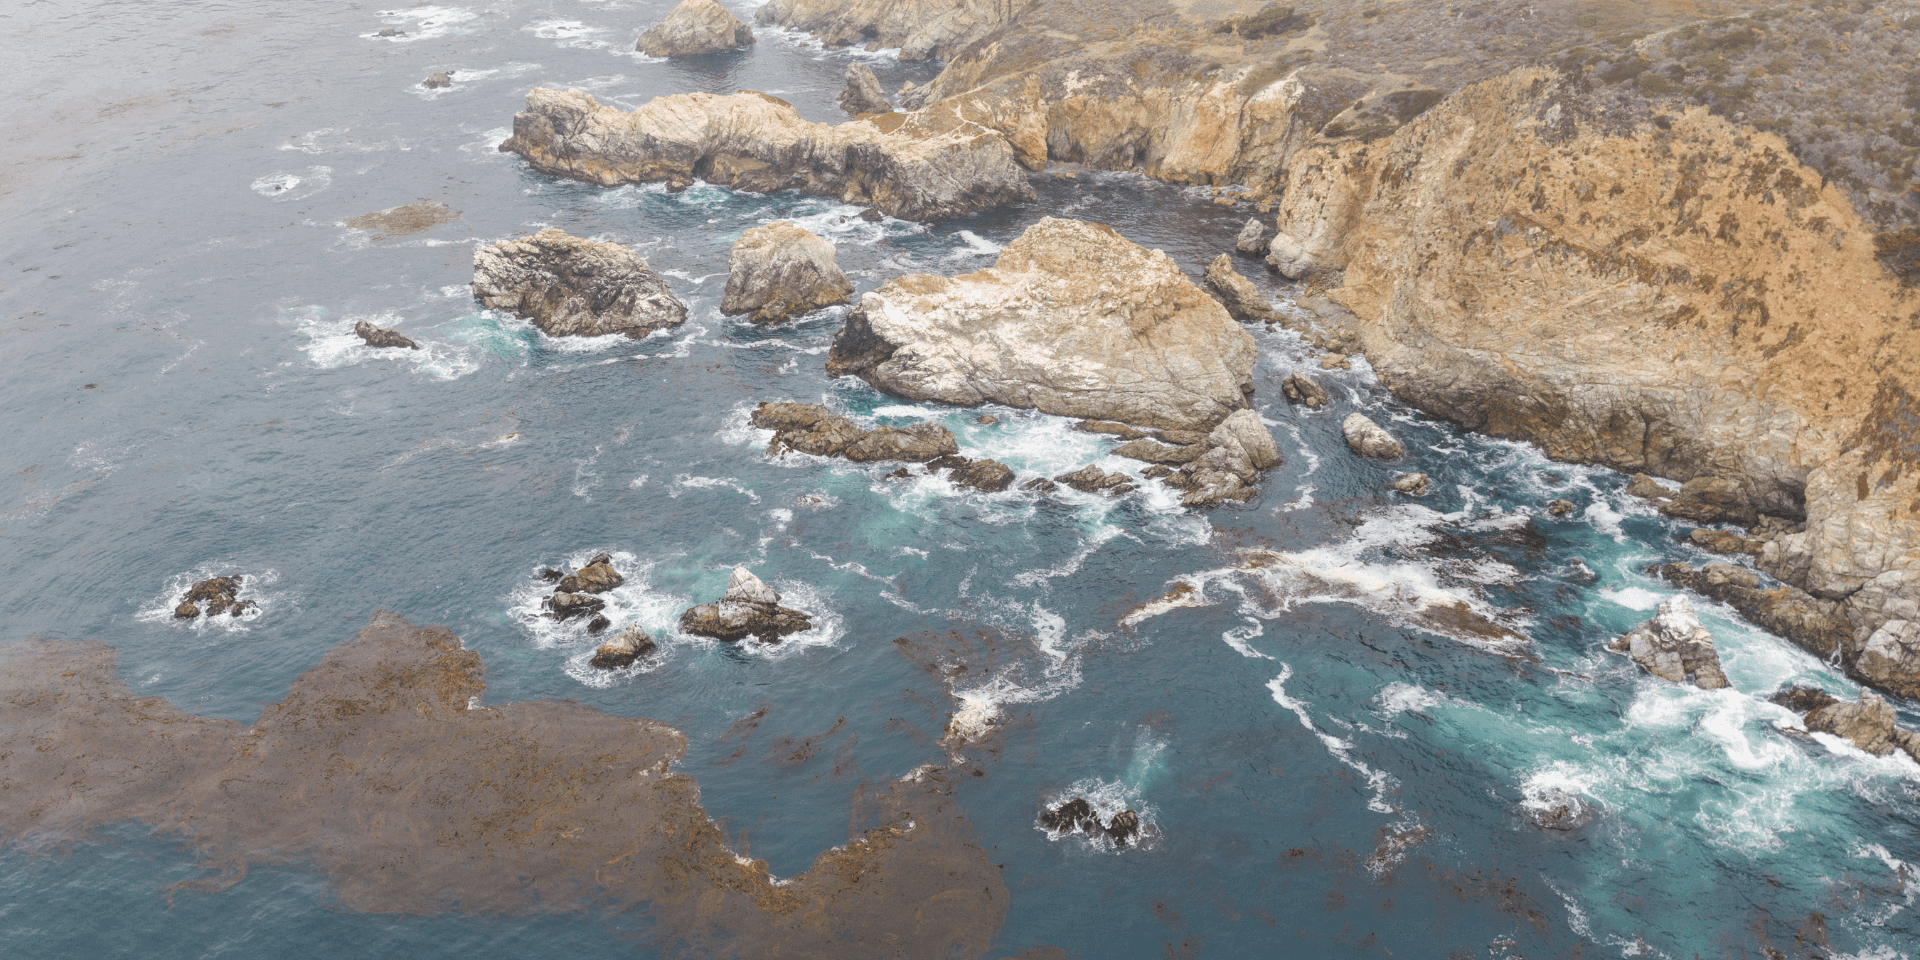
Kelp forests provide countless benefits to oceans worldwide. However, in many regions, they are declining due to stressors, some of which are accelerated by the climate crisis. We support The Nature Conservancy (TNC) in developing Kelpwatch, a platform for tracking canopy-forming kelp species to inform data-driven restoration and management of kelp forest ecosystems.
Kelpwatch is a collaboration between TNC, Woods Hole Oceanographic Institution, and the University of California, Los Angeles. GreenInfo Network leads the front-end design and web development. Kelpwatch monitors trends in kelp forest area coverage using satellite imagery as far back as 1984 and, more recently, uses machine learning to map kelp canopy extents.
Over the last few months, we have released several key updates, expanding the scope and coverage from the West Coast of the US into Southeast Alaska, Peru, and the Falkland Islands.
Browsing historical kelp forest data on Kelpwatch.org
Kelp forests play a key role in nearshore marine environments. They provide key services for coastal communities, support numerous species, and contribute to nutrient cycling and carbon removal (Saccomanno et al., 2022). Despite their cultural, environmental and economical importance, kelp forests are under unprecedented threat. It is estimated that there has been a loss of kelp of up to 40% in British Columbia Canada and as much as 96% reduction in Northern California (Reshitnyk et al., 2023).
There is a lack of consistent and reliable data (historical and current) on the growth and decline patterns of canopy-forming kelps around the oceans, which has made large-scale monitoring and research difficult. Kelpwatch is turning the tide for these data limitations by increasing accessibility to long-term and calibrated data supporting kelp canopy research and analysis.
Identifying Kelp from Satellite Imagery
Earth observation and remote sensing science can be used to monitor canopy-forming kelp forests. The underlying kelp canopy data on Kelpwatch is derived from Landsat imagery and based on classification methods developed by WHOI and UCLA (Bell et al. 2023, Houskeeper et al. 2022). Landsat’s spatial, spectral, and temporal accuracy is reliable in identifying the kelp canopies. The methodology relies on atmospherically corrected 30m resolution multispectral imagery from five Landsat sensors.
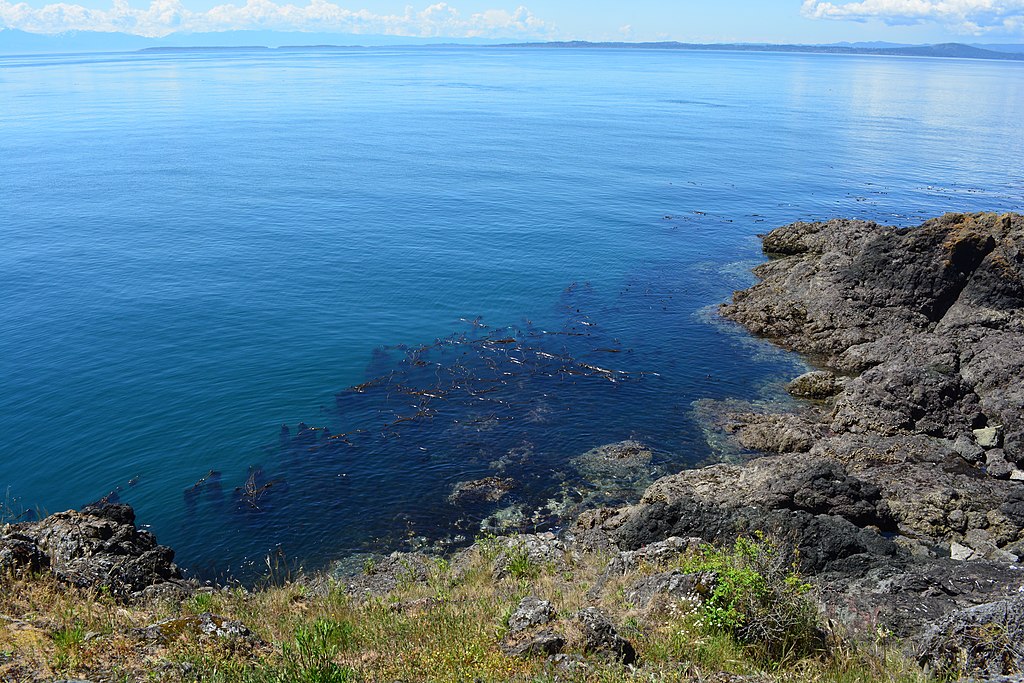
Photo credit: Joe Mabel/Wikimedia

Visualizing Historical Kelp Data
Kelpwatch exists to help resource managers, policymakers and scientists visualize the change in kelp presence over time. The data is published in NetCDF, for archival purposes, which presents difficulties for deriving geospatial data chunks that need to be accessed over the network for analysis and visualization.
Our investments in cloud-native data formats have helped Kelpwatch analyze and visualize large volumes of data. We use Zarr to aggregate data efficiently and generate vector tiles from pixel GeoJSONs for the fastest possible visualizations. We use hexbins at lower zoom levels to improve performance and make the visualization easier to understand.
Using Zarr, we can chunk the data allowing for fast queries along those chunks, instead of loading the entire dataset in memory for filtering later. Zarr also allows us to perform these queries using HTTP range requests, which means that there’s no need for a backend — just the Zarr files stored in an object storage like Amazon S3. This makes the aggregation process along different slices of data very quick.
Kelp forest growth around the Channel Islands National Park
For visualizing the kelp data, we initially considered converting the NetCDF files into Cloud Optimized GeoTIFFs (COGs). This proved to be less efficient as it meant we ended up with a large number of COGs, each representing a quarter since 1984. Scanning through these COGs and filtering each timeframe resulted in a suboptimal experience for users. Instead, vector tiles work very well for this use case.
Like other data with narrow geographic bands, kelp data is difficult to visualize at different zoom levels. At high zoom levels (continent scale), we visualize kelp as bright pixels along coastlines. Because kelp forests are usually close to coastlines, this approach lets us convey the location of kelp data to users without misrepresenting the scale of the kelp forests.
Recently, we've been experimenting with using hex bins at lower zoom levels. This has the added benefit of better visibility of kelp presence and kelp coverage extent at the global or continental level. However, it incorrectly depicts kelp forests as extending further away from coastlines. Users' feedback and scientific input will be used to determine which approach is most effective. Hex bins at lower zoom levels allow for high performance rendering of high-resolution data. As users zoom in, the hex bin size decreases to show the data precision.
A Faster and Dynamic Kelp Map
With a cloud-native approach, Kelpwatch is faster and has the infrastructure to quickly update the dynamic kelp map. This provides an excellent basis for prioritizing and monitoring restoration efforts. New geographies will become available in Kelpwatch over the coming months. We’ll help TNC process and upload new regions, and update existing regions, as the data becomes available. We’ll also continue working with GreenInfo Network to add new functionality and improvements to the tool.
One area of improvement we are exploring is using Zarr for visualization. We are working on titiler-xarray, an extension for TiTiler to serve xarray that should, in the future, serve this use case. If you want to learn more about optimizing large-scale geospatial workflows using cloud-native or to learn more about Kelpwatch, reach out to us.
What we're doing.
Latest


