

A Python library for extremely fast geospatial vector data visualization in Jupyter.

It’s too hard to quickly and interactively visualize large geospatial vector data from Python.
Ipyleaflet and folium are great for small datasets, but their performance quickly suffers as data sizes grow. Pydeck supports slightly larger datasets, but it, too, struggles with data sizes above 100,000 coordinates. GeoPandas’ plot creates a static image, which loses out on the benefits of interactivity.
We’re sharing lonboard, a new python library, to fill this need. On a dataset with 3 million points, ipyleaflet crashed after 3.5 minutes, pydeck crashed after 2.5 minutes, but lonboard successfully rendered in 2.5 seconds. We know that’s hard to believe, so here’s a clip:
Rendering 3 million points in 2.5 seconds from Python.
Not only are all 3 million points rendered on the map at once, but every point has a different color and radius, both computed from an attribute column (in this case, internet download speed). Computing those colors and radii, moving the dataset from Python to the browser, and rendering it to screen happen in just 2.5 seconds.
In a globalized world, accessing and interpreting vast datasets is crucial for organizations aiming to make informed decisions. Visualization, especially interactive visualization, is often the initial step in extracting meaningful insights from data. Yet rendering large datasets can be challenging without encountering system crashes or delays.
Consider, for instance, the dataset in this blog’s screenshots, detailing global internet download speeds and available on the AWS Open Data Registry. Such a comprehensive dataset is invaluable to humanitarian or development organizations in determining their programmatic priorities, ensuring that resources are allocated where needed. However, the sheer volume of this data presents a challenge. For these organizations, the speed at which they can render and interpret the data can significantly impact their operational efficiency and the effectiveness of their interventions.
Visualization is often the initial step in extracting meaningful insights from data.
In its initial release, lonboard includes three types of map layers: a ScatterplotLayer for Point and MultiPoint data, a PathLayer for LineString and MultiLineString data, and a SolidPolygonLayer for Polygon and MultiPolygon data.
Each layer type has attributes that you can modify to customize the rendering appearance of the map. Some of these, like radius_min_pixels are constants whose value applies to all geometries. Others — any attribute starting with the prefix get_ — can vary per geometry. So, for example, get_fill_color on the ScatterplotLayer determines the solid color for the point. Setting get_fill_color=[255, 0, 0] will set every point to red (the list’s integers refer to red, green, and blue color values), but you can also pass a binary numpy array where every geometry is set to a different color.
Swap colormaps in a fraction of a second, applying a different color per point.
Changing an attribute on a map instance doesn’t send the entire GeoDataFrame from scratch. Rather, it only transfers the newly-supplied attribute. So, changing the color scheme is faster than the initial map render.
Note that these timings are observed from a Python session running on a local machine — the same machine as the browser environment. If using lonboard from a cloud-hosted notebook, it will necessarily take longer to render as the data must be downloaded over the internet from the Python session to your browser.
Try It Out
Lonboard version 0.1 is on PyPI. Install with
python -m pip install lonboardCheck out the documentation and examples and give us your thoughts!
The Technologies Behind Lonboard’s Speed
Lonboard is built on four foundational technologies: deck.gl, GeoArrow, GeoParquet, and anywidget.
- deck.gl is a JavaScript geospatial data visualization library. Because it uses the GPU in your computer to render data, it can performantly render very large quantities of data.
- GeoArrow is a memory format for efficiently representing geospatial vector data like GeoDataFrames. GeoArrow is not compressed, and coordinates can be accessed directly.
- GeoParquet is a file format for efficiently encoding and decoding geospatial vector data. GeoParquet contains very efficient compression — which leads to small file sizes — but needs to be parsed before it can be used. (lonboard currently doesn’t use "official" GeoParquet 1.0, because the 1.0 spec requires encoding geometries as Well-Known Binary (WKB) inside of the Parquet file. lonboard uses the highly-efficient GeoArrow encoding inside of GeoParquet (which may become part of the GeoParquet spec in 1.1). This is faster and easier to write when the writer and reader are both using GeoArrow anyways.)
- anywidget is a framework for building custom Jupyter widgets that makes the process much easier.
Together, these allow lonboard to stand on the shoulders of giants, piecing together incredibly fast visualizations.
The Future of Geospatial Visualization
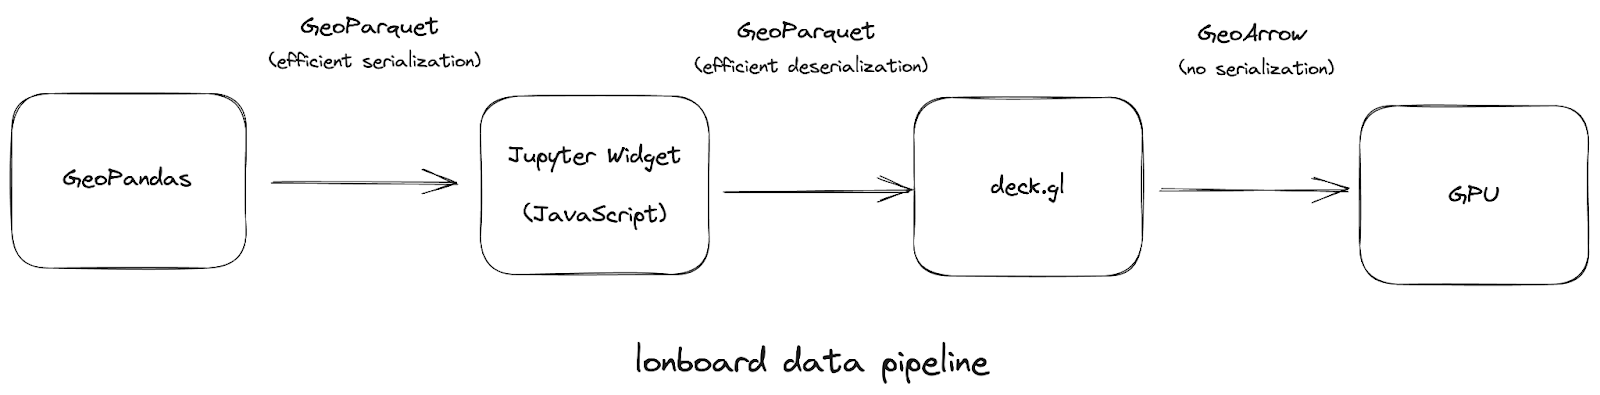
Lonboard is so fast because it moves data from Python to JavaScript (in your browser) and then from JavaScript to your Graphics Processing Unit (GPU) more efficiently than ever before. Other Python libraries for interactive maps encode data as GeoJSON to copy from Python to the browser. GeoJSON is extremely slow to read and write, resulting in a very large data file that must be copied to the browser.
With lonboard, the entire pipeline is binary. In Python, GeoPandas to GeoArrow to GeoParquet avoids a text encoding like GeoJSON, resulting in a compressed binary buffer that can be efficiently copied to the browser. In JavaScript, GeoParquet to GeoArrow offers efficient decoding (in WebAssembly). Then deck.gl can interpret the raw binary buffers of the GeoArrow table directly without any parsing (thanks to @geoarrow/deck.gl-layers).
Lonboard has no aggregation and no downscaling. If you give lonboard a dataset with a million coordinates, it’ll render every single one to the screen. It just does this process more efficiently than ever before.
The end user doesn’t care about rendering GeoJSON. They want to render their data. Lonboard focuses on abstracting how to move data efficiently so that the end user doesn’t have to think about it.
The Inspiration Behind the Name
This is a new binding to the deck.gl geospatial data visualization library. A "deck" is the part of a skateboard you ride on. What’s a fast, geospatial skateboard? A lonboard.

DALL-E rendering of a lonboard
What’s Next for Lonboard?
This is just the start of lonboard, and there’s a lot of work to be done. At the top of the list is support for multiple datasets in a single map and rendering a tooltip when clicking a geometry. We’re also investigating instances where rendering large datasets (above 1 million coordinates) crashes the Python kernel in remote environments like Binder or Colab. Let us know what you’d like to see!
What we're doing.
Latest