By Aimee Barciauskas, Alex Mandel & David Bitner.
Entwine Point Tiles for fast 3D visualization and analysis of massive point cloud data
NASA and ESA are increasingly utilizing the cloud to store and distribute Earth data, with a particular urgency around ambitious new missions that produce massive data. ICESat-2 is one such mission. ICESat-2 mission data products have been highly anticipated, having applications for everything from climate change to wildlife conservation, but the data volumes are massive at up to 1 terabyte per day. Unlocking the scientific potential of this data requires new approaches to organizing the data and new tools to process and visualize this data.
The Multi-Mission Algorithm and Analysis Platform (MAAP) is a joint ESA and NASA open science platform for global biomass modeling. In this post, we share the MAAP approach of using the AODS technology Entwine Point Tiles (EPT) for the ICESat-2 Land and Vegetation Height product (ATL08). We also talk about Analytics Optimized Data Stores (AODS) more broadly. If you are at AGU we hope you will check out our session on AODS formats and approaches (requires AGU login).

ICESat-2: Satellite Laser Altimetry Data Supports Varied Science Disciplines
The Advanced Topographic Laser Altimeter System (ATLAS) instrument aboard the ICESat-2 mission generates height profiles of the Earth’s surface. The instrument produces canopy height profiles by measuring the time between sending and receiving a laser pulse to the Earth’s surface.
AGU’s Fall Meeting 2020 includes several sessions highlighting the utility of ICESat-2 products across science disciplines. The ICESat-2 Applications Program engages scientists across hydrology, ecology and the Navy to share how they are using ICESat-2 data. Early adopters shared their work with ICESat-2 data at AGU’s ICESat-2 Town Hall in fields from wildfire to wildlife.
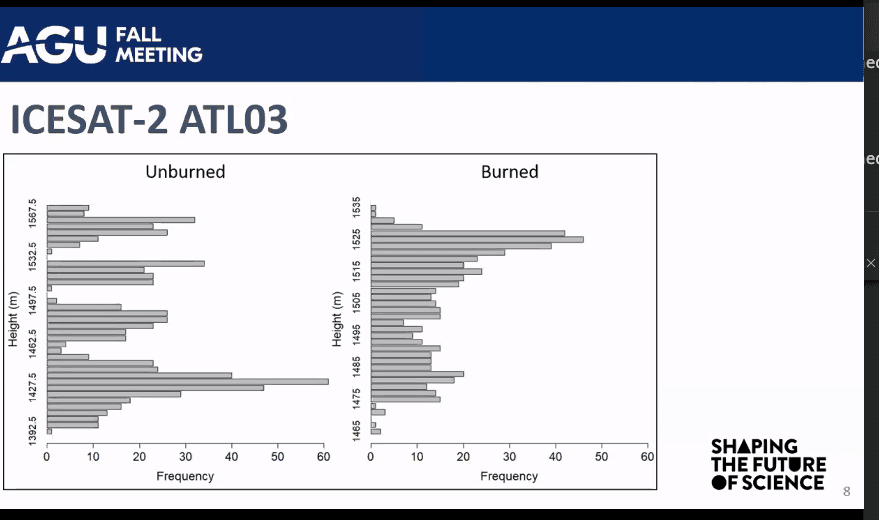
Birgit Peterson showed one great example of using ICESat-2 data for wildfire research. She uses ICESat-2 photon data to differentiate between burned and unburned vegetation. This enables “burn severity mapping” which supports better post-fire decision making and is used as an input to other risk measurements.

The following scientists featured in the town hall also showcased their work using ICESat-2 data.
- Christopher Parish of Oregon State University is fusing ICESat-2 with Landsat 8 Operational Land Imager (OLI) to create contiguous coastal and nearshore maps.
- The Naval Research Lab is using ICESat-2 to measure sea ice thickness, crucial for understanding the risk of storms to coastal communities.
- Michael Wethington (Stony Brook University) and Valerie Casasanto (University of Maryland) are using ICESat-2 to study how sea ice dynamics impact seabird populations.
Using ICESat-2 for Mapping Trees
Development Seed is working with NASA and ESA to develop a cloud-based platform for scientists to collaborate on creating global biomass models and maps. This platform, known as the Multi-Mission Algorithm and Analysis Platform, or MAAP, supplies users with analytics-optimized data stores (AODS) for handling large data volumes.
The ATL08 Land and Vegetation Height product includes tree canopy height measurements. The biomass research community is using ATL08 to scale the global spatial and temporal extent of their models¹. However, the volume of files for doing this work is prohibitively large for this task.
Key Challenge: Handling Large Data Volumes
ATLAS is one of a new class of recent space-based LiDAR sensors that produce a large volume of data with sparse geographic density. ATLAS, which came online in October 2018, produces at least 1 TB per day (Blumenfeld, 2019), and will collect data for at least 3 years. The current ATL08 version 3 subset data published on the MAAP platform is roughly 3.3 Terabytes in size. File-based access of the full extent of this data is not easy on a single-user machine.
Additionally, the biomass modeling task faces these challenges:
- Estimating global carbon stocks from proxies like canopy height requires a modeler to work with large volumes of data from the entire globe over a longer temporal range (Albinet, 2019).
- Visualizing the dataset requires identifying and then reading thousands of files for a given bounding box. HDF5 is not optimized for use via web requests. It is just not possible to run an interactive visualization on data spread across hundreds of HDF5 files.
- Like visualization, most meaningful analysis involves selecting a contiguous area of interest which can come from many granules (scenes) of HDF5 files. Each data record has X,Y, Z coordinates and additional dimensions (variables), filtering before downloading greatly reduces the size of data transfer.
AODS technologies provide access to large volumes of data without users having to download a single file. One AODS technology which has garnered a lot of attention for managing massive point clouds like the ICESat-2 data products is Entwine Point Tiles (EPT).
What are Entwine Point Tiles?
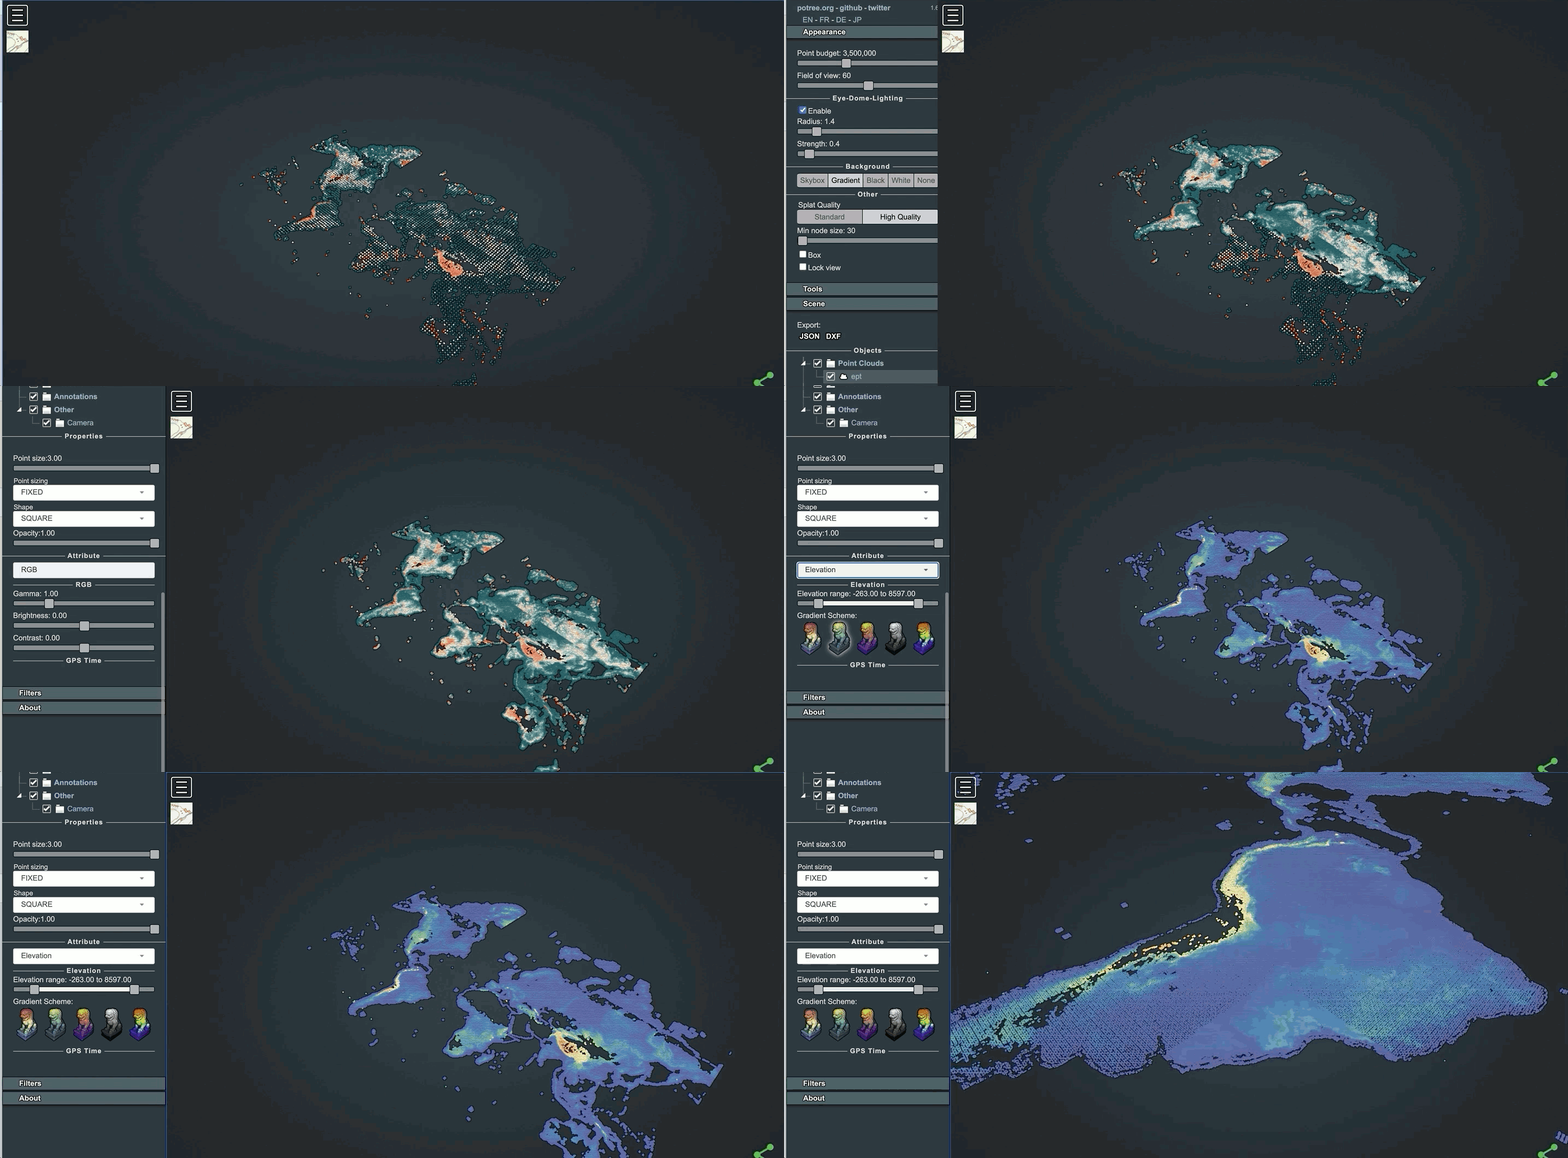
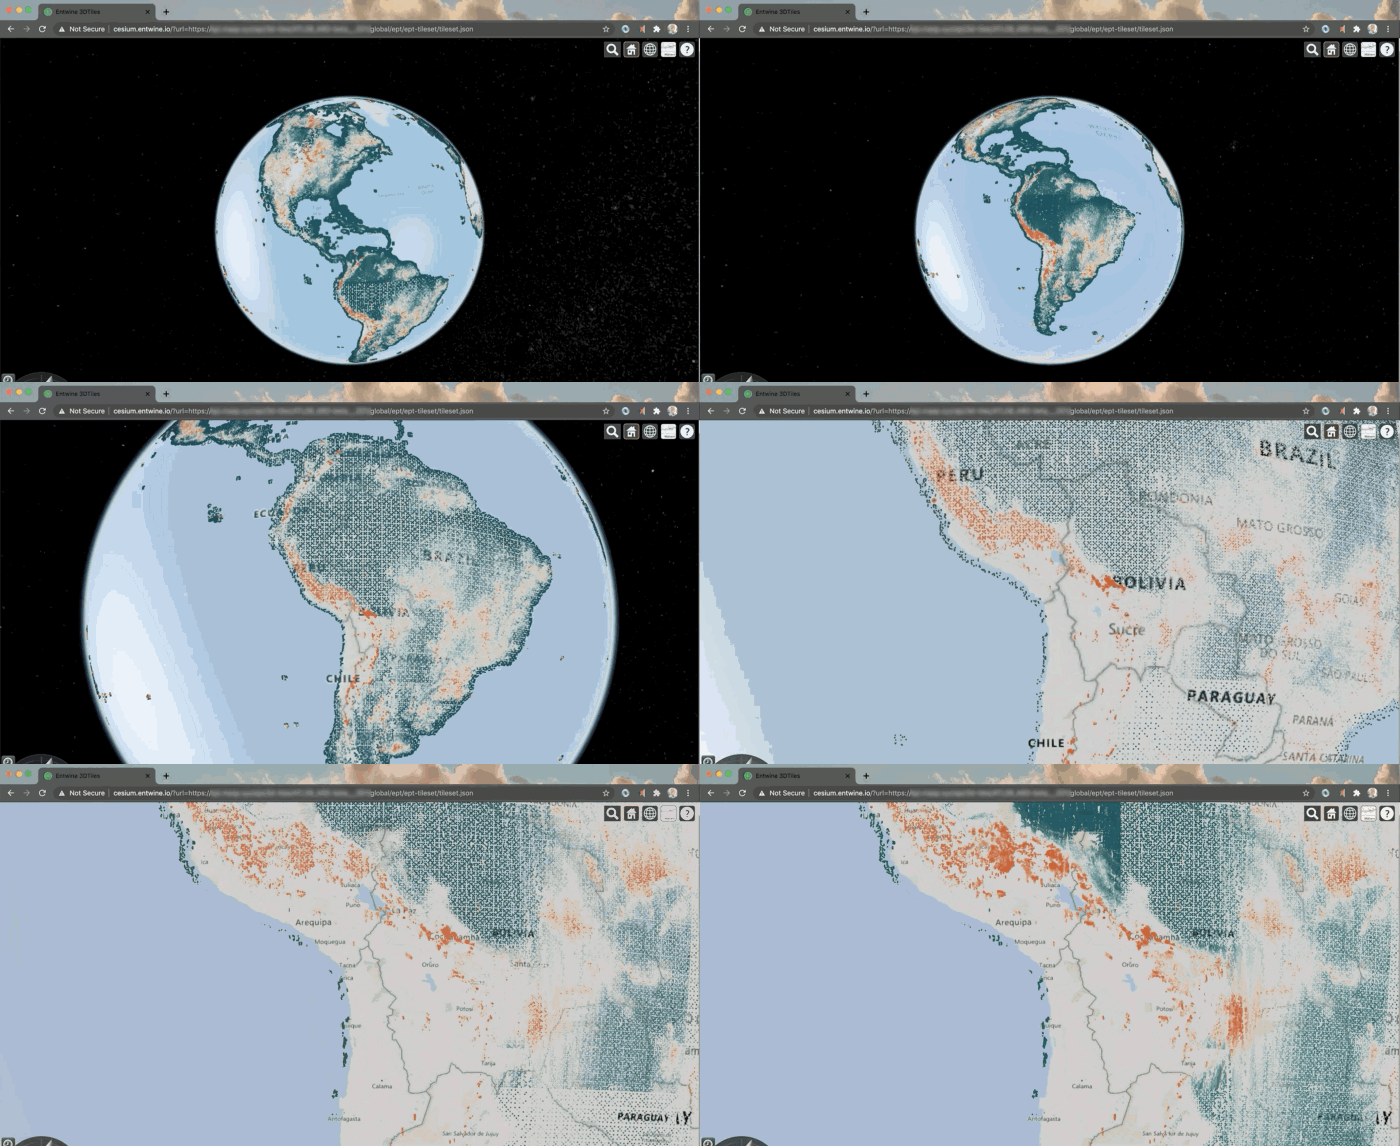
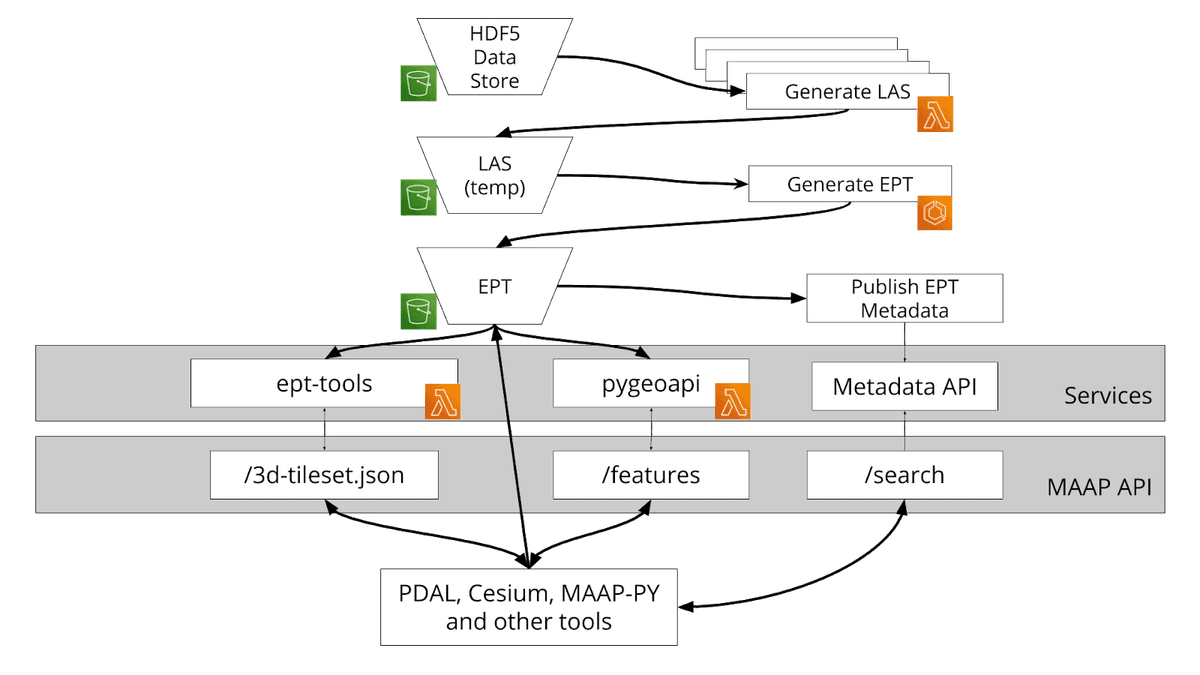
The EPT format is a cloud-optimized point cloud data format which re-organizes points into a cloud friendly spatially indexed data structure. MAAP uses AWS S3 to store an ATL08 EPT store and serve the data over OGC specified APIs: 3DTiles for visualization and Features for querying. These APIs allow for interactive 3D visualizations in a web browser, including notebook environments and facilitates on the fly subsetting for interactive data exploration, all of which can be applied to other similar sensors.

How did we do it?
The MAAP data team used AWS Step Functions to generate an ATL08 EPT store for a subset of variables. 101,088 source HDF5 files were transformed into intermediary LAS files using the Point Data Abstraction LIbrary (PDAL). The Entwine library used these LAS files to index over 639 million individual points, with global coverage starting in October 2018 through mid-July 2020².
Description of Entwine Point Tile (EPT) for ATL08:
- A 3D octree spatial index reorganizes data by 3D geography to optimize spatial queries. (Mosa et al., 2012)
- Over 100,000 input files are combined into an indexed directory structure that can be queried as a single data source. In this case we used online cloud storage: S3 on AWS.
The data store normalizes data to common LiDAR dimensions:
- X: Longitude
- Y: Latitude
- Z: DEM height
- ElevationLow: segment terrain height best fit (h_te_best_fit)
- HeightAboveGround: canopy height (h_canopy)
- OriginId: a reference to an origin file for each data point
- GpsTime: standardize timestamps to GpsTime for cross dataset querying.

Here’s how to use it!
See the source code or launch an example jupyter (python) notebook for exploring the data store with Binder.
Are you attending AGU?!
We are presenting this work in a poster session at the 2020 American Geophysical Sciences (AGU) Fall Meeting in a poster session “Lessons Learned on Supporting Analysis Ready Data (ARD) with Analytics Optimized Data Stores/Services (AODS) in Collaborative Analysis Platforms” (requires AGU login).
Other posters in this session:
- Data store alternatives for the Multi-Mission Algorithm and Analysis Platform (MAAP), Author: Dai Hai Ton That, NASA IMPACT
- Sentinel-2 Cloud-Optimized GeoTIFF Public Dataset, Author: Matt Hanson, Element84
- Using TileDB and Pangeo to Provide Access to Thousands of NetCDF Files as Analysis-Ready Data, Author: Peter Killick, MET Office Informatics Lab
- Pangeo-Forge: Crowdsourcing Analysis-Ready, Cloud Optimized Data, Author: Ryan Abernathy, Lamont Doherty Earth Observatory at Columbia University
- Cloudy Oceanography using Analysis Ready Datasets, Author: Chelle Gentemann, Fallaron Institute
- Analysis Ready SST Data for the Oceans, Author: Edward Armstrong, NASA JPL
- Hybrid Serverless Cloud and Supercomputing Workflow to Support Methane Plume Detection and Regional Analysis, Joseph Jacob, NASA JPL
We look forward to discussing:
- What are the shared lessons learned from building and using collaborative science platforms?
- What is the difference between Analysis Ready Data and Analytics Optimized Data Stores and why does it matter?
- How are analytics optimizations being used in practice?
Footnotes
- In addition to ICESat-2, the MAAP provides scientists with other field, airborne and satellite optical, SAR, and LiDAR data to use for their biomass models. Two other new missions this community is excited about are the BIOMASS (SAR) and GEDI (LiDAR) satellite missions to scale their biomass modeling globally.
- The MAAP team expects to update the Entwine Point Tile store with the most recent ICESat-2 ATL08 product in early 2021.
References
- Albinet, C., Whitehurst, A.S., Jewell, L.A. et al. A Joint ESA-NASA Multi-mission Algorithm and Analysis Platform (MAAP) for Biomass, NISAR, and GEDI. Surv Geophys 40, 1017–1027 (2019). https://doi.org/10.1007/s10712-019-09541-z
- Blumenfeld, J., 2019. ICESat-2 Data Usher in a New Age of Exploration | Earthdata [WWW Document]. URL https://earthdata.nasa.gov/learn/articles/tools-and-technology-articles/icesat-2-data/ (accessed 11.17.20).
- Mosa, A.S.M., Schön, B., Bertolotto, M., Laefer, D.F., 2012. Evaluating the Benefits of Octree-based Indexing for Lidar Data. Photogramm. Eng. Remote Sens. 78, 927–934. https://doi.org/10.14358/PERS.78.9.927
What we're doing.
Latest