Movement data shows challenges in managing a pandemic in a nation where 100M people live in informal settlements
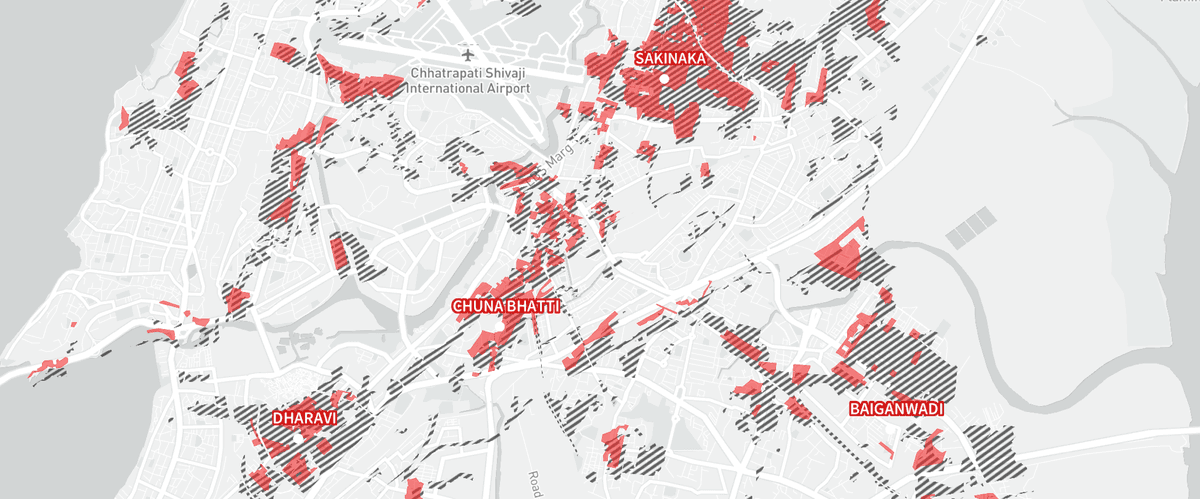
 Containment Zones & Slum Areas in Mumbai, June 2020
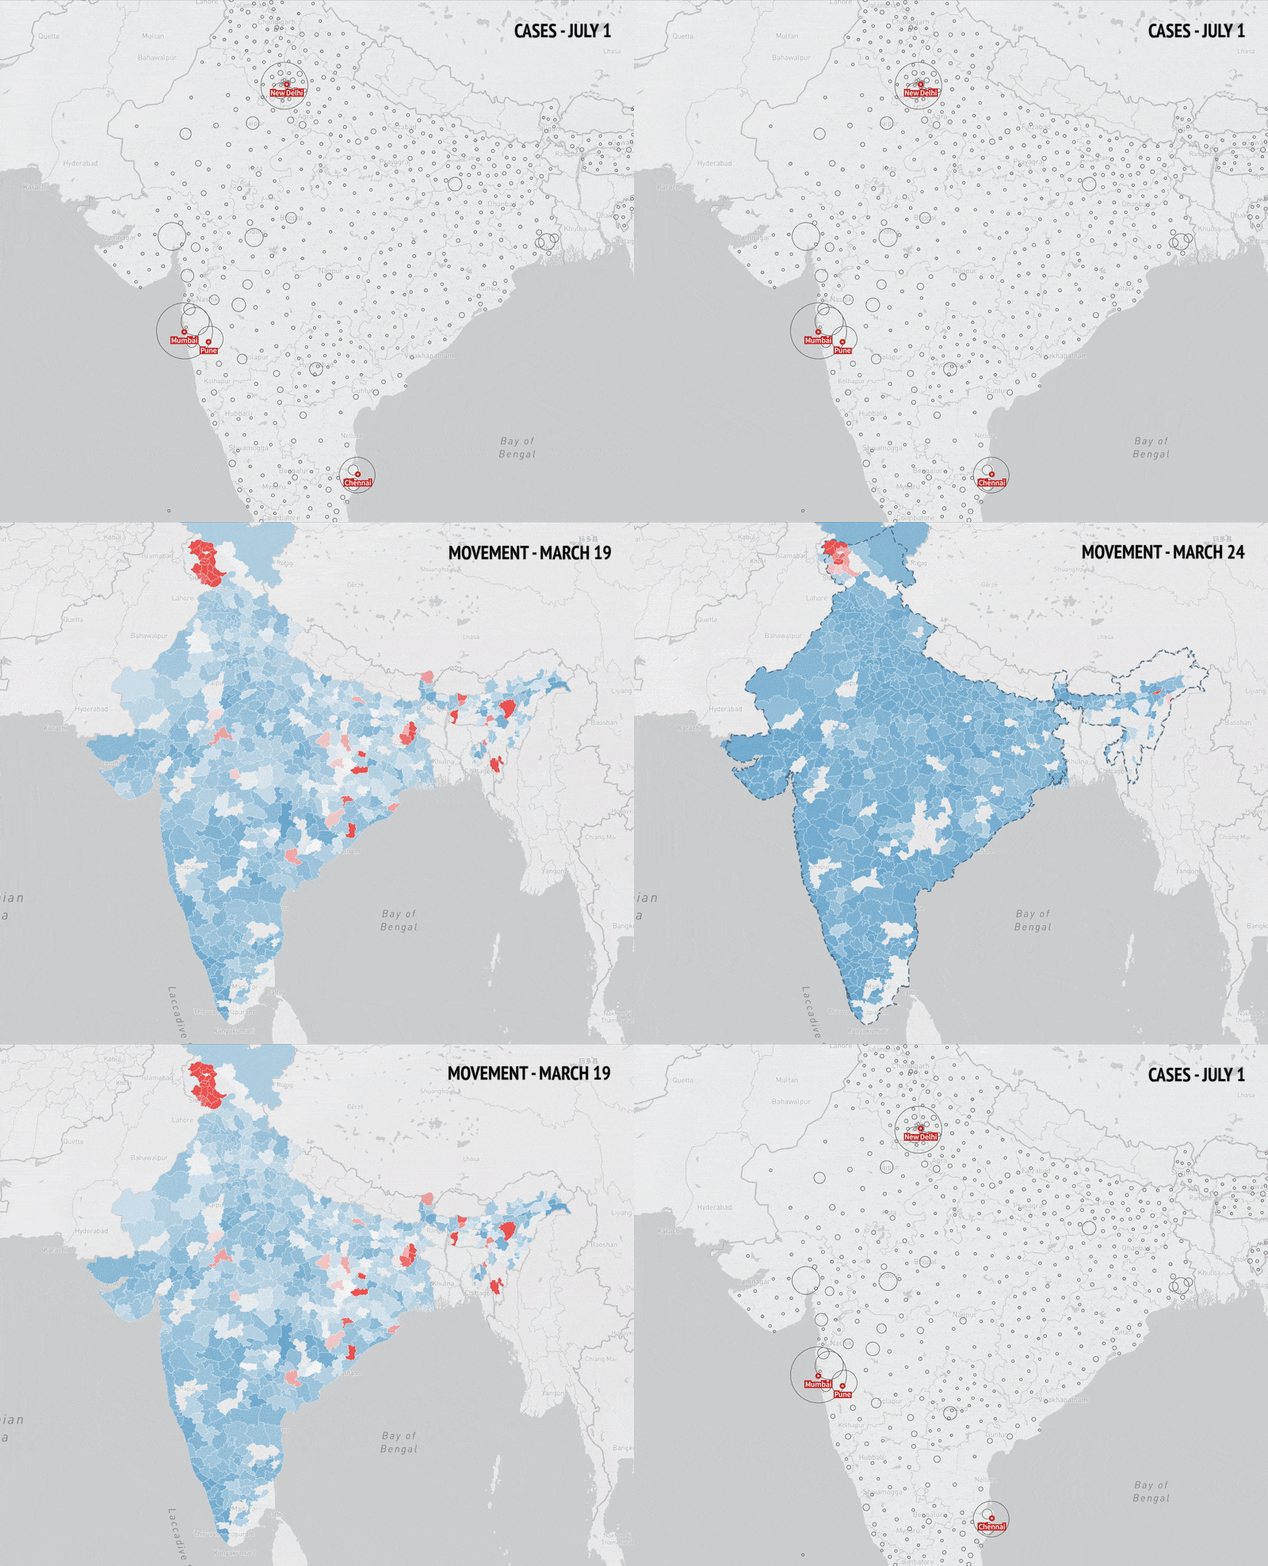
As of July 14, India has more than 900,000 confirmed cases of COVID-19. Only the US and Brazil have more confirmed cases. India took an aggressive approach to lock down around the country in March after only a few dozen confirmed cases. Since lifting most movement restrictions, cases have rapidly increased in India, particularly in large cities with significant urban slums.


Mapbox Movement Data provides a look at how these restrictions unfolded in different communities across India. When combined with population data on vulnerability and COVID disease dynamics, a compelling story emerges around the impact of national and local policies through the pandemic. We explored mobility trends pre/post the lockdown announcement, and looked at the high concentration of containment zones in slums and vulnerable areas.
Explore the interactive story →
Movement in cities has a high correlation to the spread of the virus. Reopening plans must consider highly localized movement patterns to design policies that are appropriate for very different communities.
As governments begin to feel pressure to re-open their economies, our aim is to help them do so safely and more efficiently by collecting, publishing, and better understanding geospatial and location data surrounding COVID. Correlations between movement and social policies reveal that in both urban and rural areas, no two response efforts yield the same results. To learn more about our COVID mobility work, check out our latest piece on diverging patterns as states in the U.S. begin to open up again and the impact on case numbers.
What we're doing.
Latest