Weaving automation into the mapping workflow adding AI to the Tasking Manager
- Estimated
- 5 min read
Creating maps from satellite imagery is a tedious task. Objects we often care about mapping (e.g., buildings and roads) lie in a complex visual soup of trees, shadows, and clouds and can vary in their appearance across the world. We rely on human mappers because attempts to fully automate this process with machine learning (ML) have proven difficult — even with modern deep learning methods. While ML algorithms scale much better than human effort, they are relatively rigid and haven’t been able to capture the flexibility and contextual awareness that comes naturally to humans. At Development Seed, we’re betting that a fertile middle ground is to provide mappers with an “AI-Assist” toolbox to augment their mapping workflow. Our aim is to supercharge human mappers with ML instead of supplanting them.

Tasking Manager Workflow
The Tasking Manager (TM) is a popular tool built by the Humanitarian OpenStreetMap Team (HOT) for organizing multiple mappers working on a single mapping project. In the last year, the TM helped coordinate over 135,000 mappers throughout the world. It’s used by both humanitarian organizations (e.g., to build a post-flood map) as well as development organizations (e.g., to track infrastructure growth and achieve the UN’s SDGs).
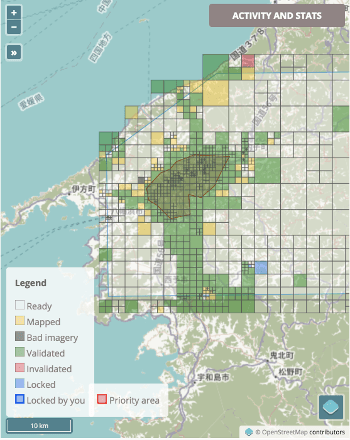
 The Tasking Manager tool helps groups of mappers work together without accidentally repeating or undoing each other’s efforts. It also helps mappers visualize the status of squares by assigning different colors depending on if a square is ready, mapped, validated, etc. This example is from Project 4888 to map infrastructure in Japan after flooding and landslides in July 2018.
After defining an area to map, the Tasking Manager divides this region into dozens or hundreds of individual task squares each representing a small parcel to be mapped in OpenStreetMap (OSM). By limiting mappers to one task at a time, the TM prevents participants from stepping on each other’s toes. The TM represents an important portal for many mappers to participate in and track some of the most time-sensitive mapping efforts across the globe.
While widely-used, the TM has room for improvement. The relevant limitations here stem from the fact that no information from the underlying satellite imagery makes it into the TM visualization. Specifically, this means that:
-
Mappers have no insights into the relative difficulty of each task square (unless they open individual unmapped tasks in an editor).
-
There’s also no concrete way to estimate the remaining effort needed to complete an entire mapping project.
-
There is no method to suggest task squares based on an individual’s preference or skill level.
Adding ML with OSM Task Metrics
We’re building an ML-powered toolbox to overcome some of these limitations. OSM Task Metrics works by pulling satellite imagery for each TM task square, deriving new information from with an ML algorithm, and then augmenting the the TM’s visual interface. Here, we are specifically interested in estimating unmapped building area. For each task square, we’re using a building segmentation model to estimate the total square meters of buildings from satellite imagery. We then calculate the total building area already mapped in OSM. By subtracting the two, we can estimate how much building area is left to be mapped and show that discrepancy to users.
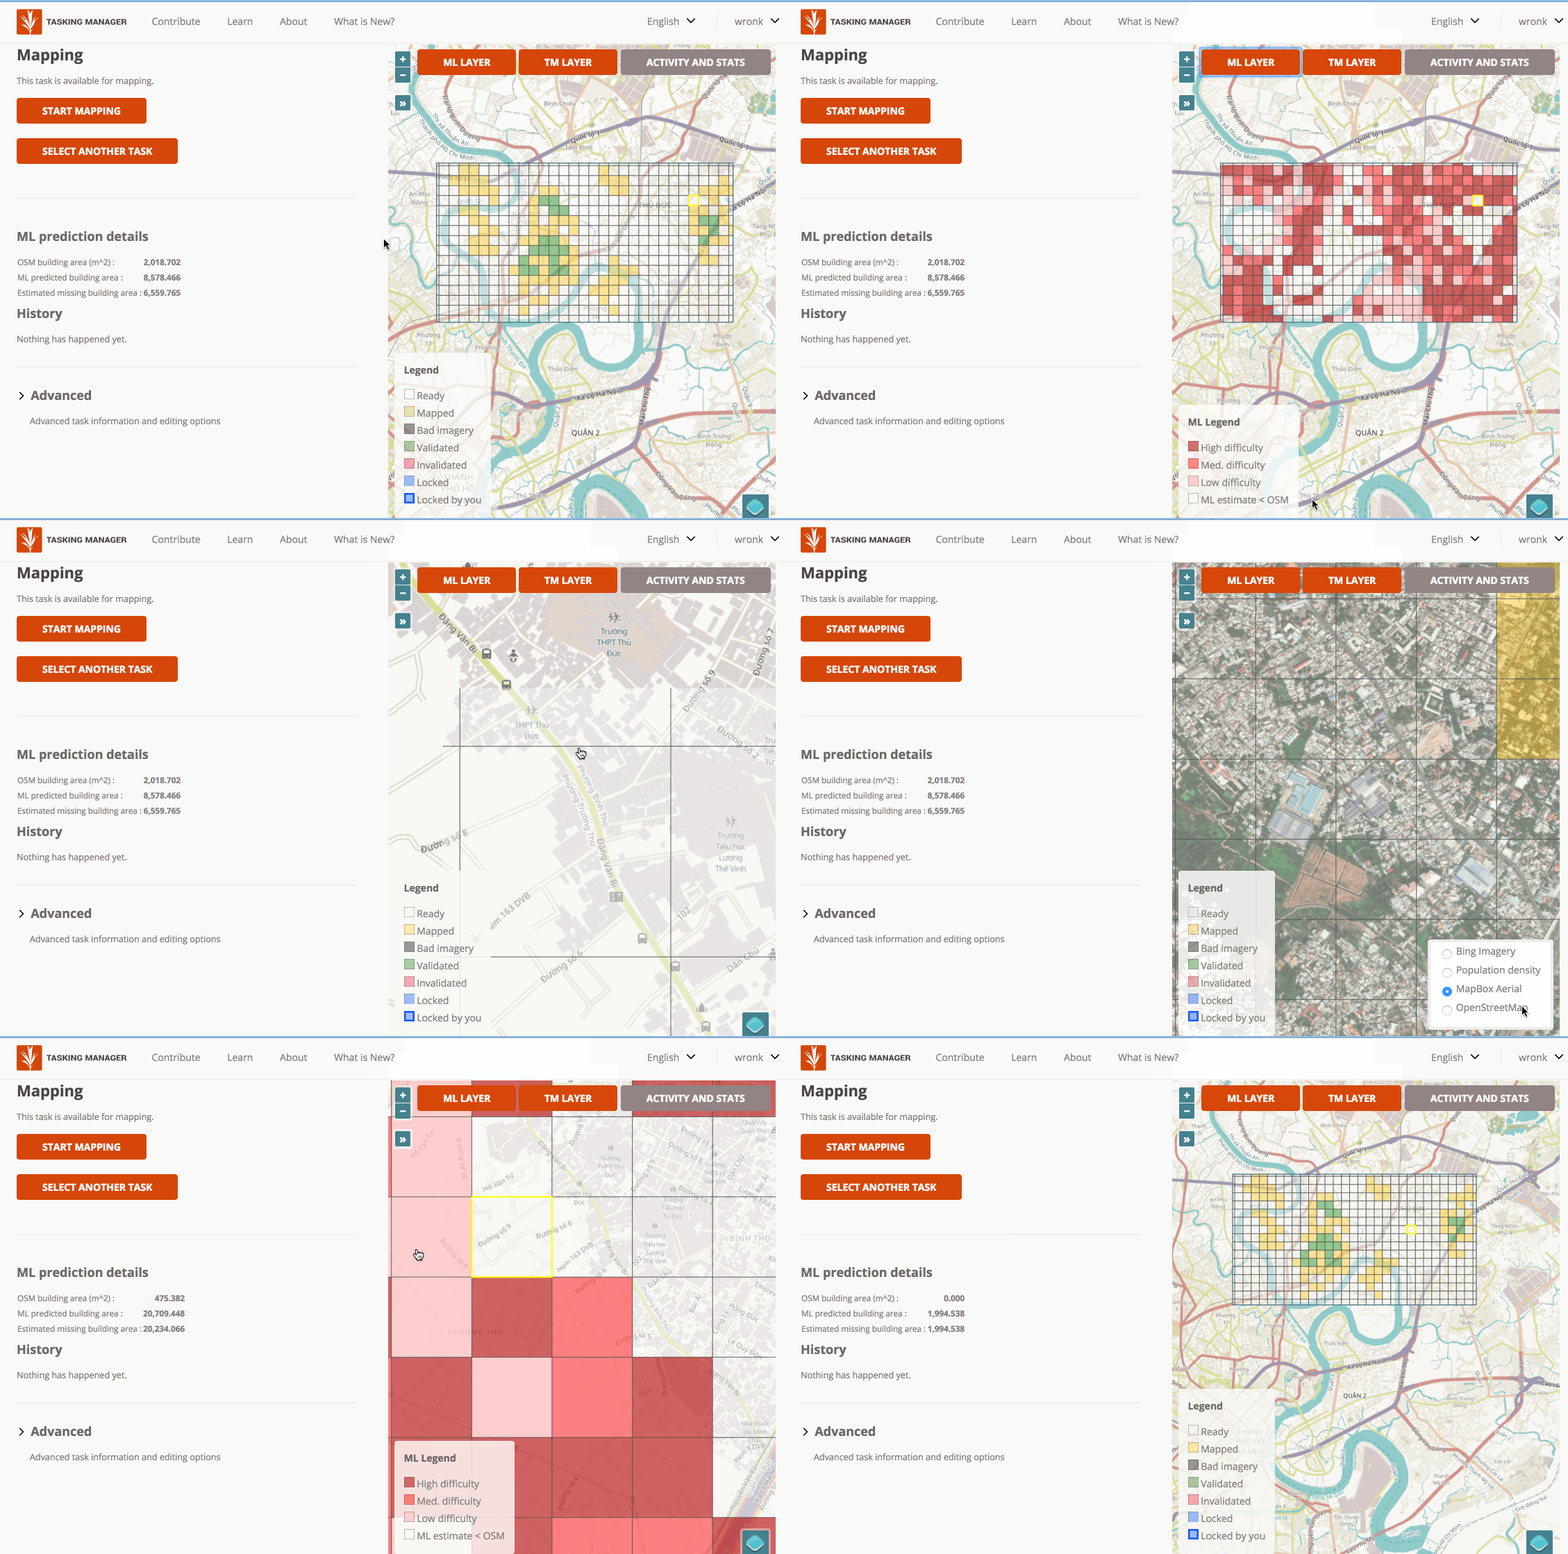
 Adding ML-derived information to the Tasking Manager. Users can toggle our ML layer within the TM to visualize missing building area — deeper shades of red indicate more missing buildings to be mapped. This animation zooms in on a swath of Ho Chi Minh City where only only buildings in the right side of the window are mapped in OSM. The ML layer indicates this through the red task squares on the left side of the same region. To see the live beta, click the GIF or the link at the end of this post.
We’re planning a few improvements for OSM Task Metrics in the future:
-
Expand the machine learning component to also calculate total missing road infrastructure for each task square.
-
Improve the machine learning models as our visualization is only as good as the underlying ML estimates. Our building segmentation model works reasonably well, but we are exploring better training sets to improve accuracy and generalizability so that it’s more useful globally.
-
Work with HOT to add a recommendation system. Any method that matches task squares with a user’s preferences or skill level will make individuals more efficient and reduce the time to a completed map.
You can check out our live demo here. We’ll be working with HOT and the Tasking Manager development team to make these tools available to the wider mapping community as soon as possible.
What we're doing.
Latest
