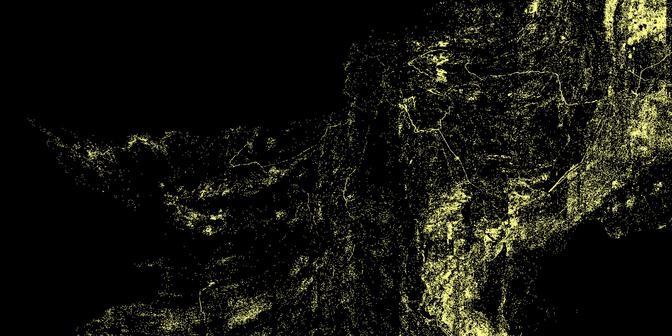
The most up-to-date report for this work is available here.
High-resolution satellite imagery and modern machine learning (ML) techniques can vastly improve our ability to map the world. While machines can’t match humans at all tasks, they can increase the rate and accuracy of human work. In a pilot project to map the electricity grid in Pakistan, we developed an ML model that sped up the work of our Data Team, a group of professional human mappers, by about 15–20x. We believe that this pairing of humans and machines is a powerful strategy to boost the speed and scale of current mapping efforts.
We’re using this strategy to tackle the problem of electricity access, which remains limited in many developing regions. Underlying this problem is the fact that an accurate map of the grid rarely exists; often, these schematics are outdated, incomplete, or do not exist at all. Without this map, governments and other organizations can’t make good choices about how to maintain or extend the grid. This lack of information can even complicate decisions about alternative energy sources (e.g., solar- or wind-power) — without knowing where the conventional grid exists, it’s hard to intelligently deploy alternatives (Szabó et al., 2011). The World Bank is especially invested in this area, and we are partnering with them to develop a new method of mapping high-voltage (HV) infrastructure at a country-wide scale.
Mapping the grid’s backbone
The most recognizable components of a HV grid are its towers — metal structures tens of meters tall that are visible from satellite imagery. These towers (and the high-voltage lines connecting them) form the network’s backbone and transmit electricity across long distances. Skilled mappers working with satellite imagery can identify these prominent towers in multiple contexts (e.g., desert, forest, urban areas, etc.), but their efforts don’t scale well at this task — it’s slow and tedious to review large regions. In small-scale tests with our Data Team, we found that our professional mappers could cover about 120 km2 per hour; to manually map a country the size of Pakistan, that would require over 7000 hours of work (or one person working 40 hour weeks for 3.5 years straight).
To reduce the manual effort needed, we built an ML model to detect HV towers within satellite images. We were able to train a single ML model — specifically, the Xception convolutional neural network (Chollet, 2016) — to recognize HV towers in satellite imagery covering Nigeria, Pakistan, and Zambia. Machine learning pipelines can process hundreds of thousands of images per hour, so we were able to quickly generate country-wide maps of the grid. Our model achieved a high true positive rate while testing, but it was not perfect: wind turbines, sand dunes with long thin shadows, and gridded farmland all confused it. At a macro scale, however, the long lines of true positive predictions stand out against the unordered cloud of false positives.
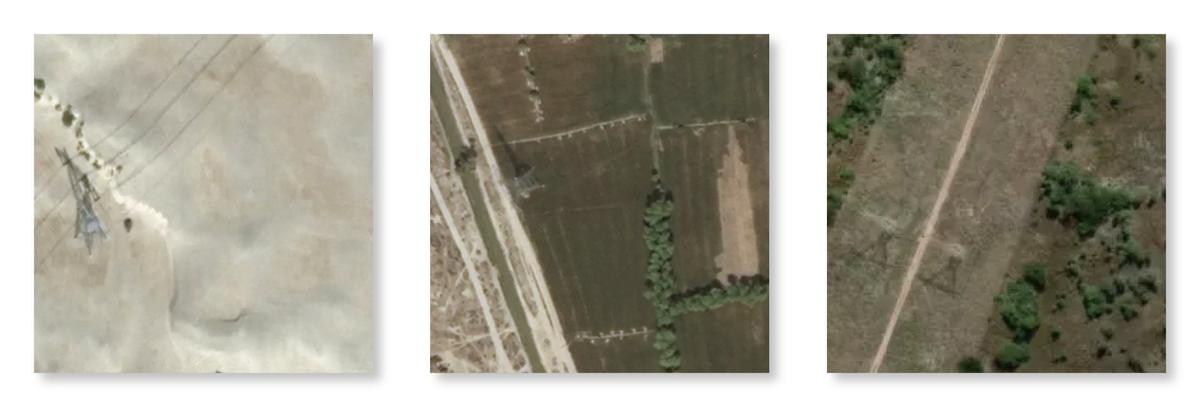 Examples of images the model correctly identifies (i.e., true positives). Left: desert region from Pakistan; middle: agricultural region in Pakistan; right: scrubland in Nigeria. Note that the same predictive model is used across all three countries processed in this work.
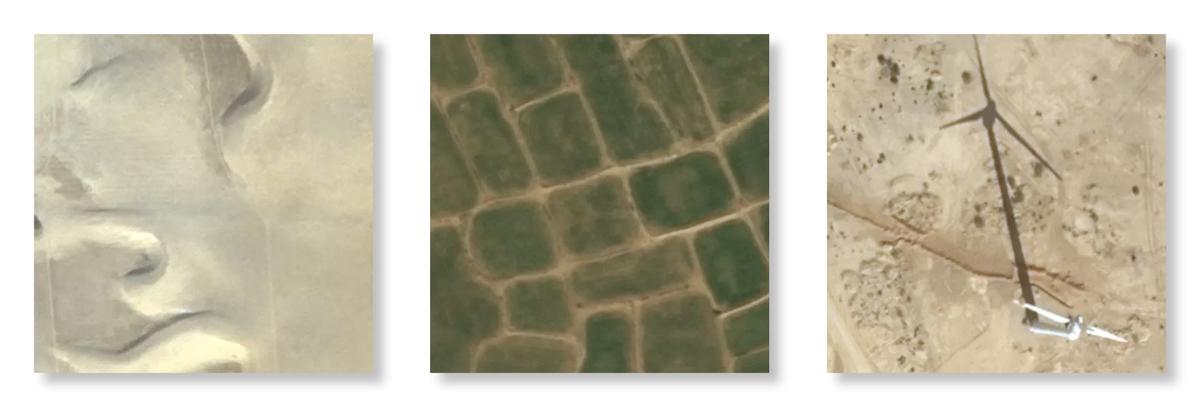 Examples of images the model incorrectly identifies (i.e., false positives). Left: desert region with sand dunes and wispy shadows; middle: agricultural region in Pakistan with many short line segments; right: wind turbine. We found that the model made more errors on terrain and features that were under-represented in our training data.
Connecting humans and machines
To map the HV network, we combined the strengths of humans (high accuracy) with machines (rapid throughput) in a symbiotic way. We used the ML model to generate a country-wide prediction map indicating areas likely to contain HV towers. With this map, our Data Team focused their efforts on high-value areas indicated by the model instead of manually reviewing the entire country. Specifically, they were tasked with adding all HV towers, transmission lines, and substations to OpenStreetMap. In the ML world, this strategy is known as Intelligence Augmentation (IA) as our goal is to improve the speed of human mapping rather than replace the mappers with a 100% automated system (the aim of Artificial Intelligence). Using this workflow, our Data Team was able to map 2,035 km2 per hour, adding 204.3 HV towers per hour — a speedup of 16x and 19.3x, respectively.
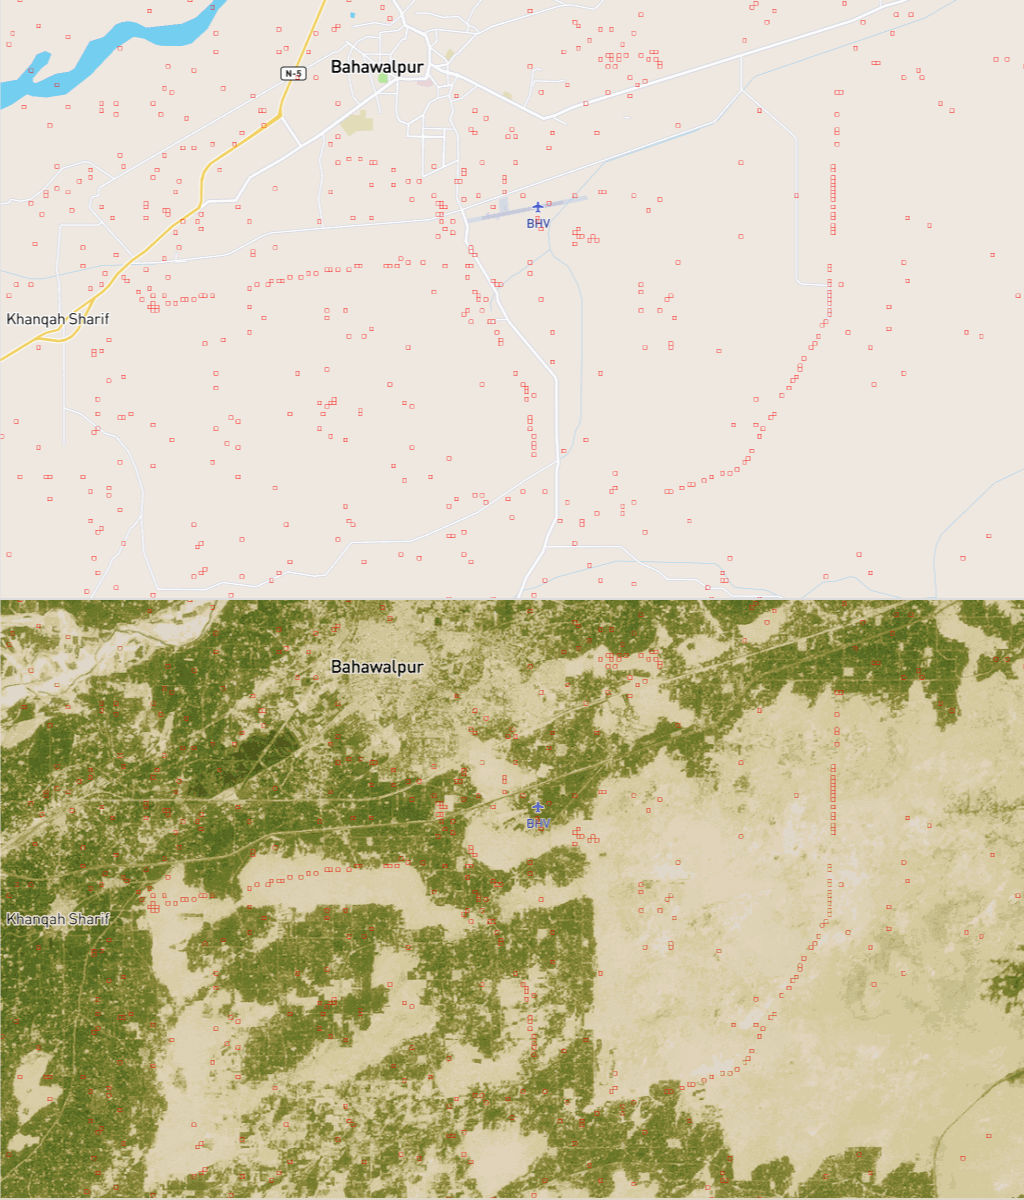 Machine learning predictions overlaid on top of the map. Each small red square represents an image where the model predicted that a HV tower was present. Note the strings of positive predictions (where HV towers are present) against the sparse, unordered cloud of false positives.
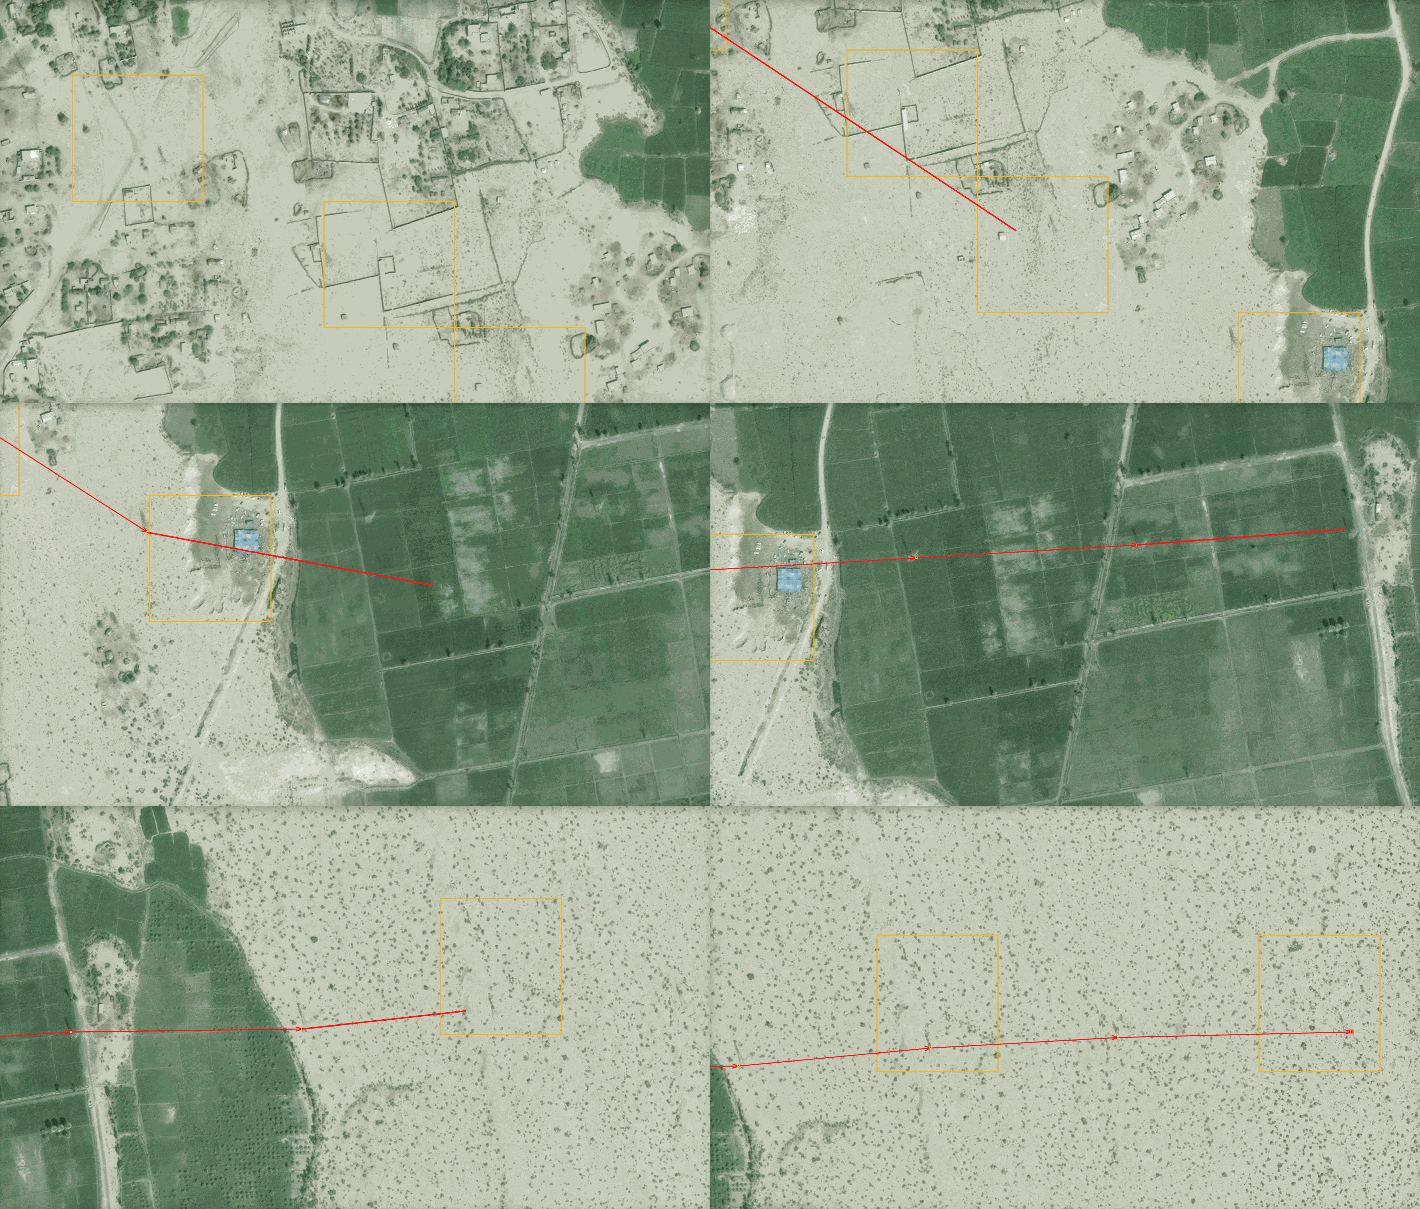 Manual tracing with machine learning overlay. As before, small regions where the model predicts a HV tower are outlined and overlaid on top of satellite imagery. The data team then maps tower to tower using the overlay as a guide. Video frame rate reflects actual speed.
Looking forward
The initial results are encouraging, but we are working on several ways to sharpen our approach:
-
The Data Team is experimenting with streamlined workflows to better integrate the ML predictions into their mapping software.
-
The ML Team is optimizing the model by supplementing the training data with imagery from areas where it initially performed poorly.
-
The ML Team will extend the model to identify electricity substations as these are important nodes within the electricity network.
After improving our pipeline, we will apply this workflow to other countries with poor maps of the electric grid, starting with Nigeria and Zambia [1]. By this project’s end, the complete HV infrastructure for all three countries will be openly available in OpenStreetMap. Looking toward next steps, we anticipate that this same approach could be applied to map other features, including: roads, radio and cell phone towers, solar panels, irrigated fields, schools or almost any other object visible from space. With this framework, we hope to accelerate the production and use of open data to address issues facing the developing world.
- The final report with results for all three countries is available here.
What we're doing.
Latest
