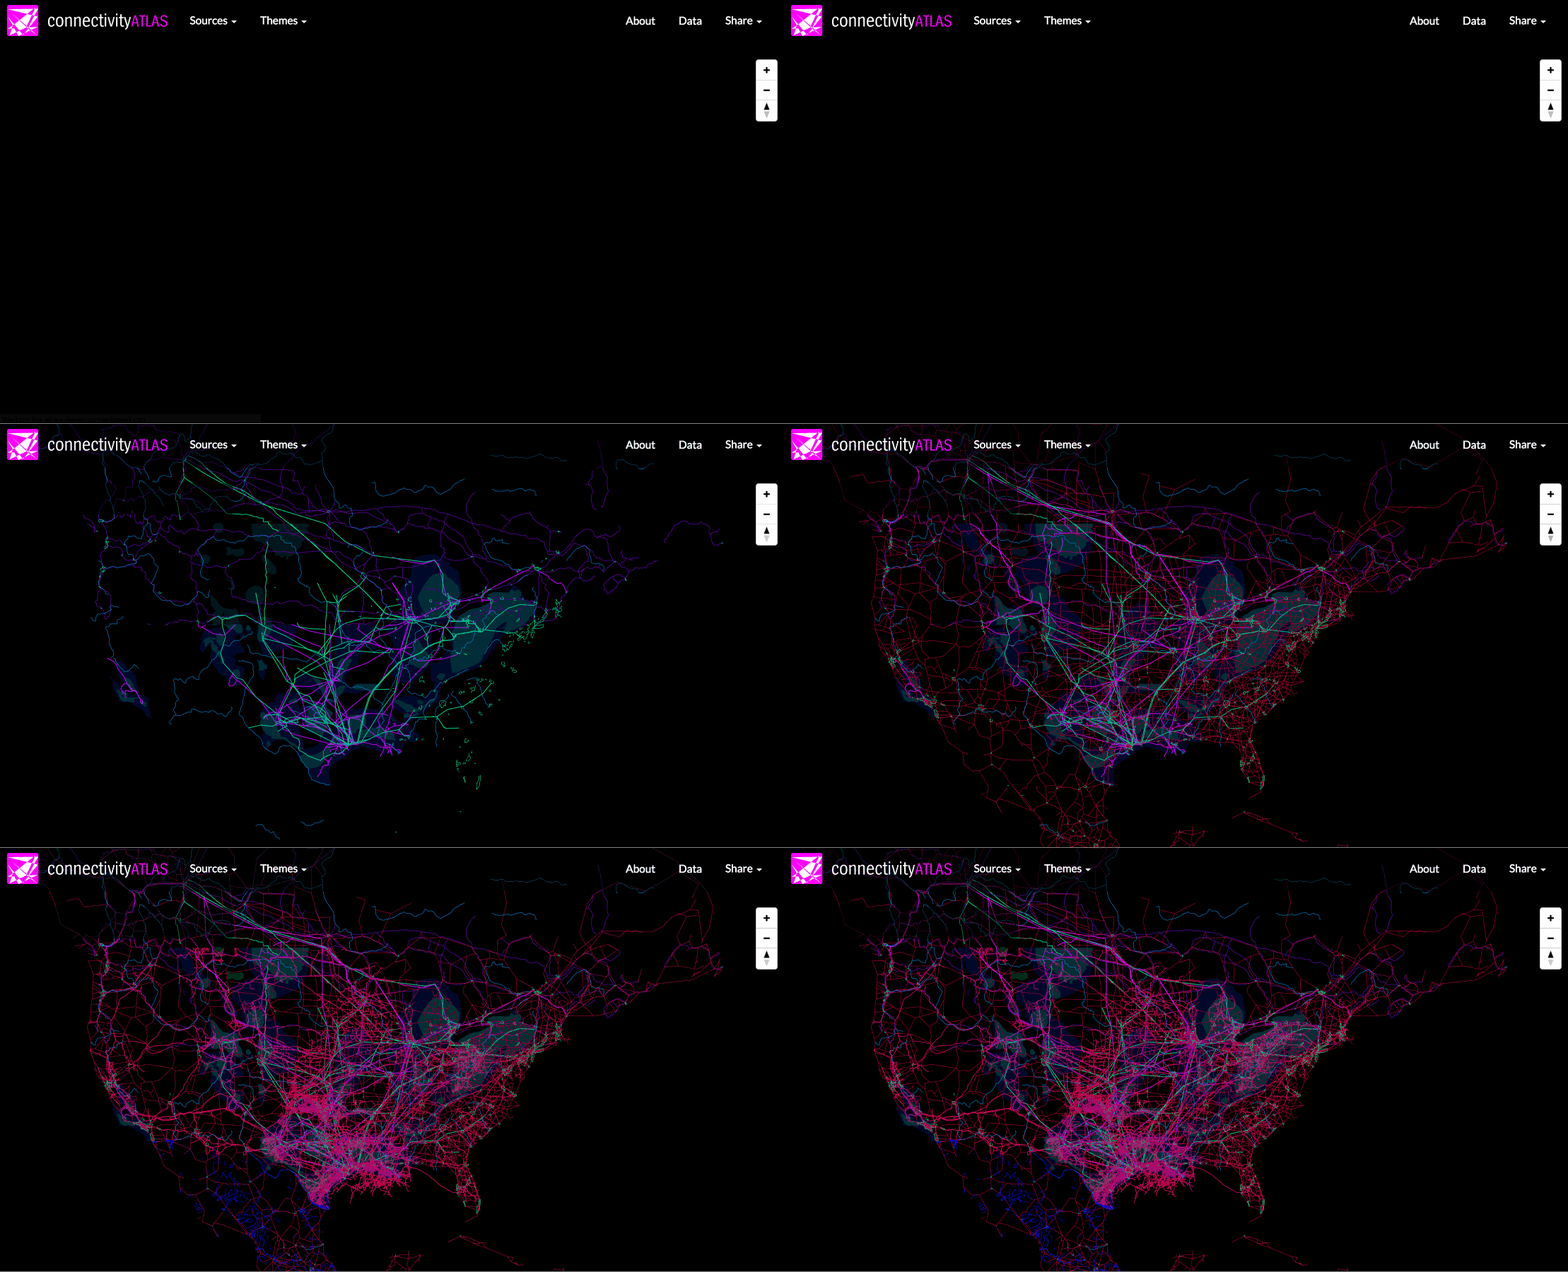
We recently launched the first iteration of the Connectivity Altas, a project to map infrastructures on a global scale. From roads and rivers to internet and electricity lines, these intricate and vast networks exist everywhere we are. Considering that infrastructure is a broad classification, mapping out these different systems provides a unique insight into how these networks are dispersed onto the globe. Since the Connectivity Atlas was our first significant dive into Mapbox GL, we wanted to share some notes about our experience.
The challenge of complex data
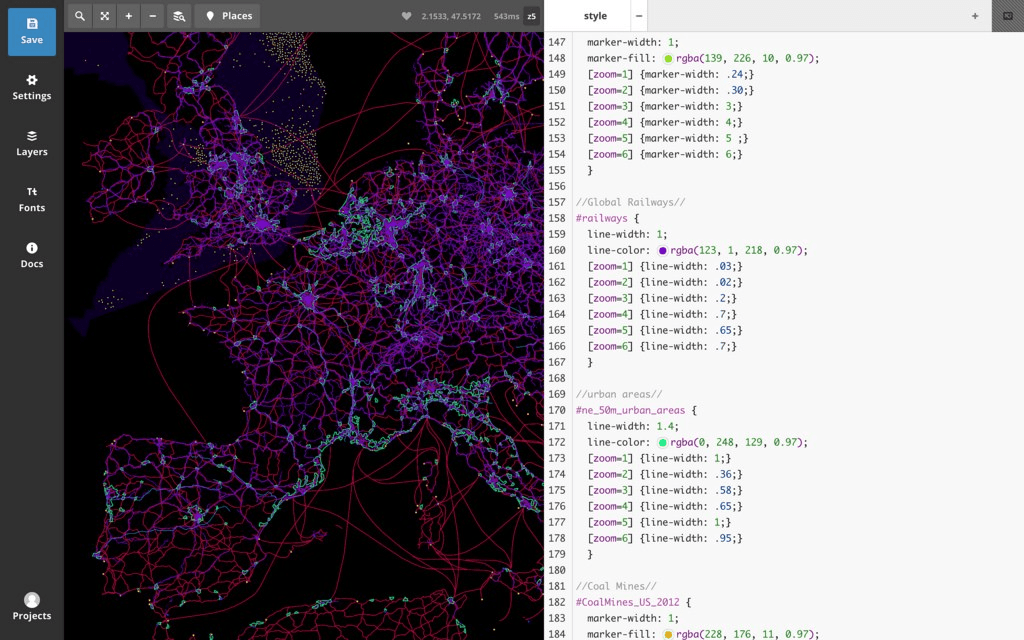
I started to build the map using Mapbox Studio importing each layer into Studio as a separate data source and styling each layer using Carto CSS. This workflow worked fine for a while, but over time might have led to hundreds of sources and styles pushing the limit of our Mapbox account and our organizational skills. This approach would also lead to performance issues as our data sets increase.

Rendering vector data in the browser
We considered alternative workflows and ultimately decided to use Mapbox GL for various reasons.
-
We like vector tiles (super crisp)
-
We like rendering styles in the browser (it makes for faster styling / instant results)
-
Better organization — we used a jekyll collection to add styles into a master JSON

What we learned
Vector tile platforms like GL allow for much faster rendering of complex data by using the graphics processor in the same way that a video game does. The tools for working with Mapbox GL are still limited. For example, we had to write our own tooltip functionality to expose the meta information in each layer. But we know the Mapbox folks are cooking up some new tools for GL, and we look forward to using GL for other projects.
Open Infrastructure Data
All of the data on the Connectivity Atlas is open and available for reuse. This is a collaborative project, and you can participate by sharing and suggesting data. This way we can produce a map of our profound inter-connectedness as well as an oddly beautiful web of global infrastructure.
What we're doing.
Latest
