

Yesterday the government of Mexico launched datos.gob.mx to open up government data across all ministries. We built a mapping tool for ministries to quickly build rich maps from data on the site. The tool also makes it easier to combine government data with other open datasets. This provides context and meaning to complex government data.
The first dataset that we mapped was all 2013 funds for disaster response and reconstruction. The map plots thousands of reconstruction projects across 45 natural disasters, including Hurricane Manual and Ingrid which affected two-thirds of Mexico, killing 192 people and causing $75 billion pesos in damage.
This is an incredibily rich and complex dataset. But this data alone is not particularly helpful. We need to better understand the context to understand why government invested funds the way that it did, evaluate the effectiveness of these investments, and plan for future events.
To help understand the context we pulled open satellite data from the days following Hurricane Ingrid to better understand the extend of flooding caused by the Hurricane. We used landsat-util to download the data, and produced a false color composite to highlight water.
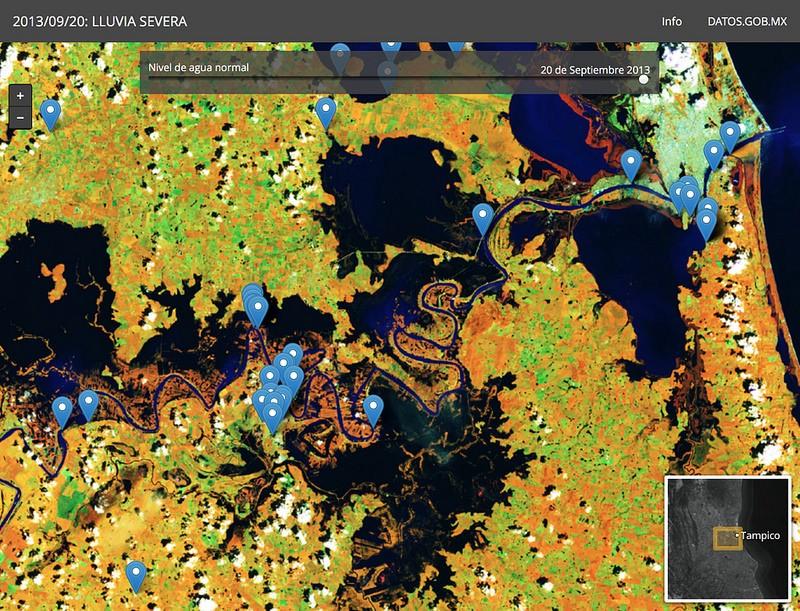
The resulting map shows reconstruction projects in the context of the flooding.
View the government of Mexico’s map building tool on github. We used landsat-util to get the imagery and processed it with this script.
What we're doing.
Latest