

Following the 2009 election in Afghanistan, this picture helped quantify the extent of elections fraud in that election.
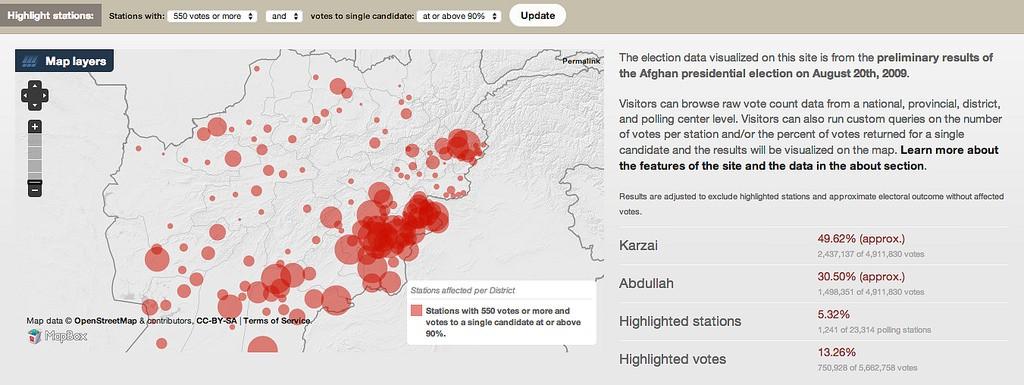
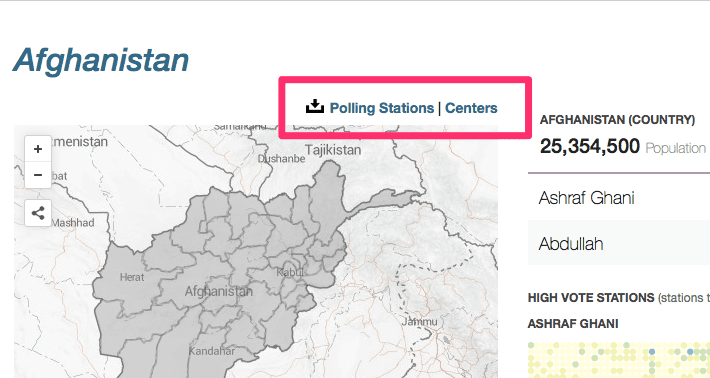
This map was part of afghanistanelectiondata.org, a open election data site that we built with the National Democratic Institute. It showed a simple but meaningful story: many polling stations returning a high ballot count had cast over 90% of those votes for a single candidate.
Results from recent runoff election are again marred by fraud and ballot stuffing, leaving Afghans and the international community looking to understand the extent of affected ballots in the preliminary results.
Open Data to Support the Recount
Today NDI releases data on all 22,399 polling stations, giving tools for citizens and policy-makers to dig deep into the results, and investigate where fraud may have occurred. As the nation-wide recount restarts, it is more important than ever for citizens to have access to data that allows them to hold this process accountable.
The data, which is processed from preliminary results released by the Afghanistan International Election Committee, is freely available for download on the site.
Analyzing Election Results for Fraud
When election fraud becomes more sophisticated, the tools to analyze election results must improve. As in 2009, stations with high vote counts that return an unusual percent for one person are good targets for investigation.
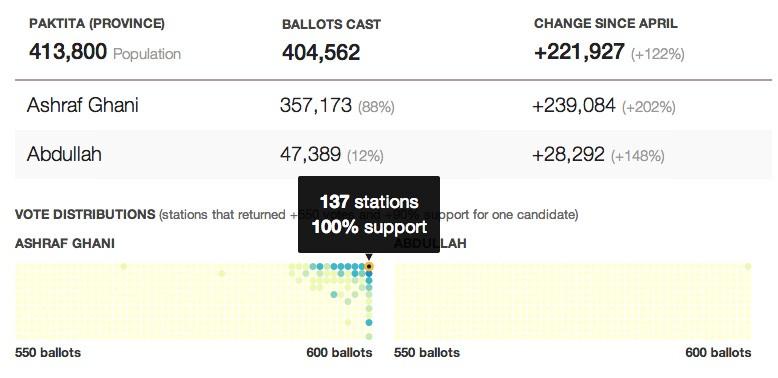
A heatmap shows the distribution of stations that meet this criteria. In Paktika, the results show Ashraf Ghani winning 100% of 600 ballots in well over a hundred stations. The number of ballots supposedly cast in this province is roughly equal to it’s estimated population.
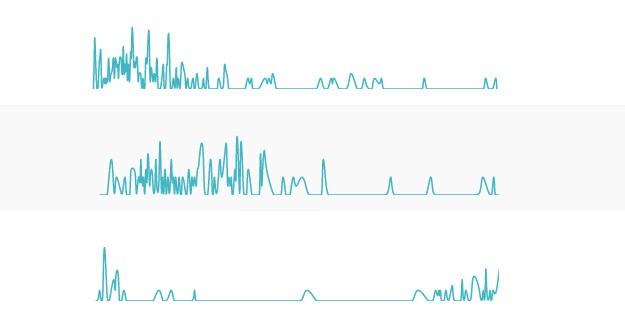
The full distribution of polling stations can provide further clues. We plotted the number of stations at each vote count for every district and province. Some show an even distribution, as in Farah, Panjsher, and Zabul, shown below.
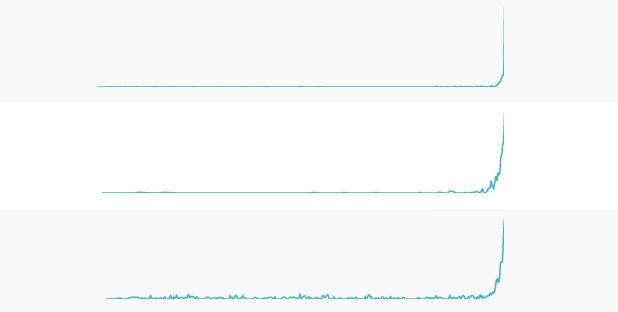
Contrast this with the density lines for Paktika, Khost, and Baghlan, where the majority of stations skew towards returning a full 600 votes, with very few other stations in the spread.
The site looks at other critical questions such as: Where did the number votes exceed the population? and Where did each candidate gain and lose votes? To facilitate further analysis by others, all data and results are available for download in CSV format.
What we're doing.
Latest