

Today the United Nations Development Programme (UNDP) relaunched the open.undp.org portal with new subnational visualizations and significant UI improvements. This marks another big step forward in transparency within the agency and strengthens its commitment to open and share financial and project data. Watch this video for a tour of how the open data portal works.
These new visualizations are being released as UNDP steps into a new role as host of the International Aid Transparency Initiative (IATI), which was announced by UNDP Head Helen Clark last week. Read on for a sample of the new data views and other improvements that we’ve been working with UNDP to add to the portal in the past month.
Improved visualizations and UI
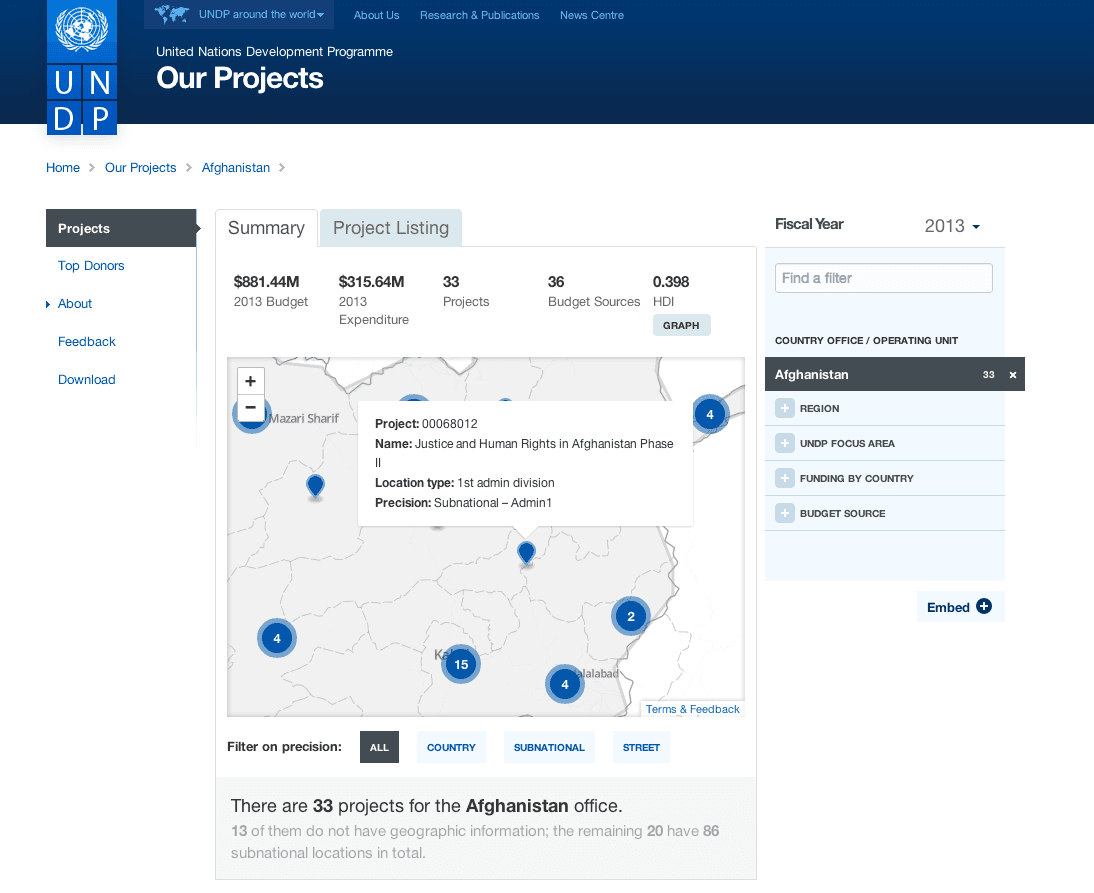
Subnational visualizations have been expanded to show where projects are being implemented across the country. Visualizations now include clustering by location and filtering by coordinate accuracy.
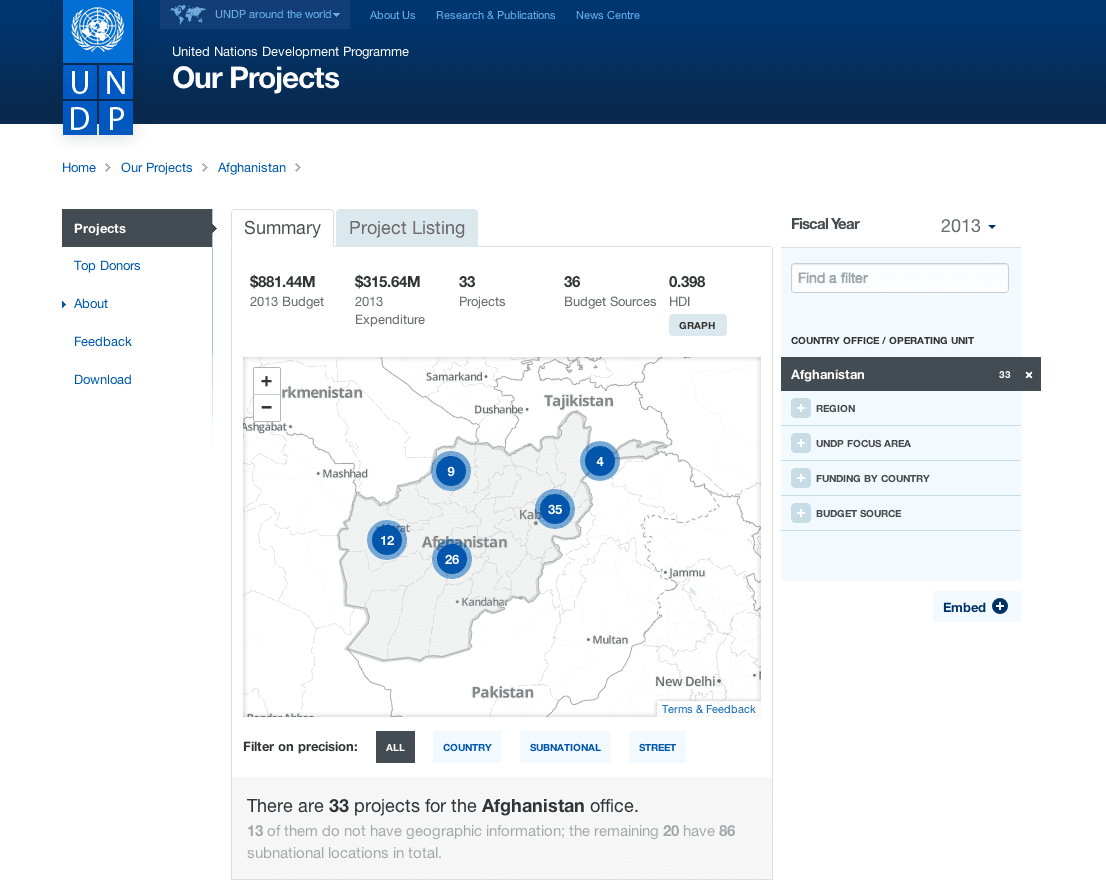
Activities of a project are now mapped and included in the overall country view. Each view now gives the ability to link directly to a project and explore the project in more detail.
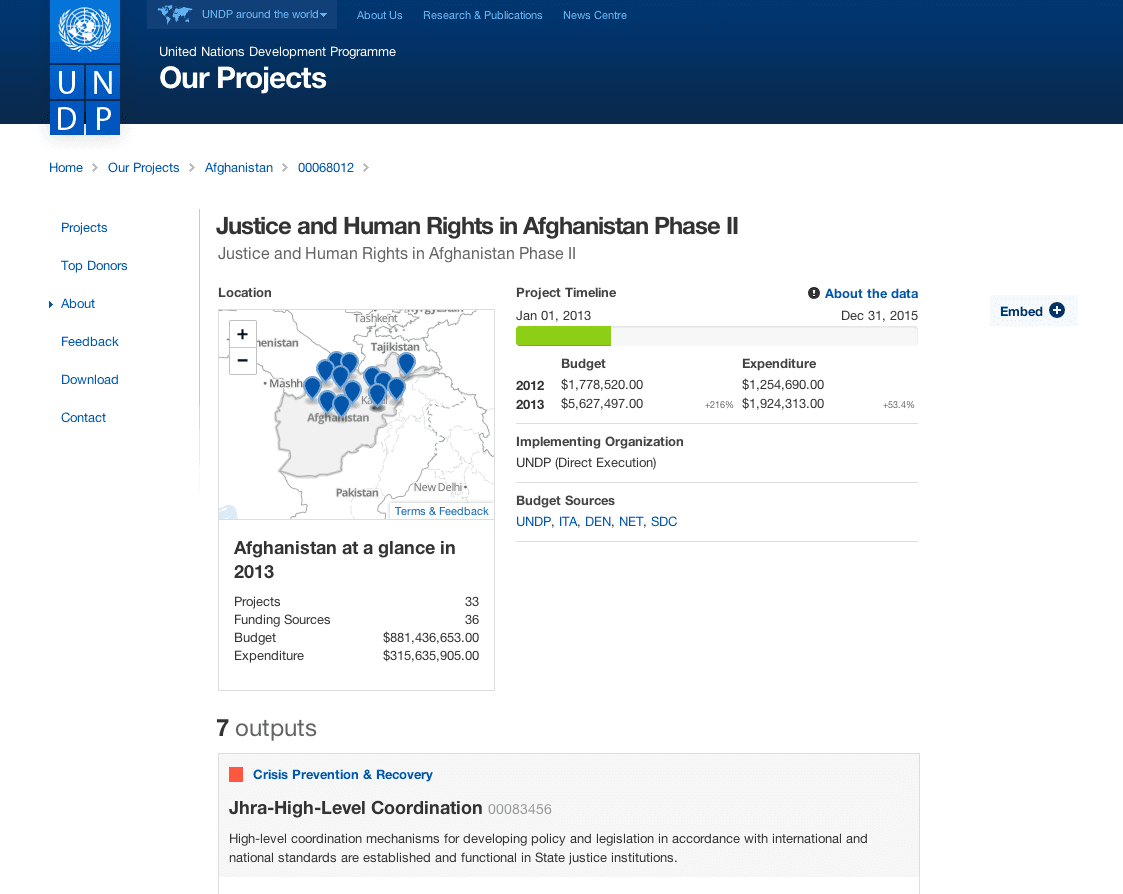
Within the project pages, we’ve improved the subnational views and embed functionality to share individual project details.
We’re excited to relaunch with these new visualizations with UNDP. Check out open.undp.org and explore the new and updated data.
What we're doing.
Latest