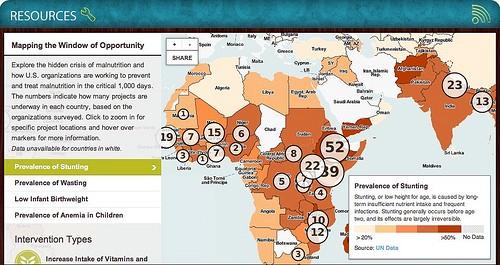
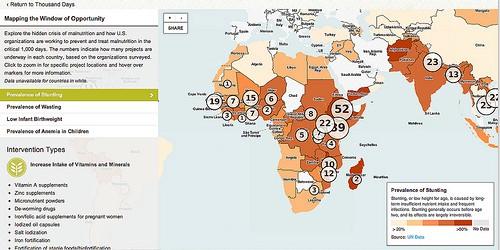
We partnered with ThousandDays.org to map the nutrition projects of 15 of their partner organizations. Their work, covering 27 countries where USAID has committed to nutrition investments, uses proven, cost effective interventions to fight malnutrition in the critical 1,000 day window between pregnancy and a child’s second birthday.

##Identifying opportunities for NGOs
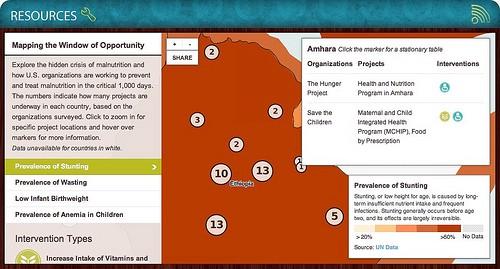
The map highlights areas of strong program coverage and gaps by placing contextual nutrition layers underneath project locations. In Ethiopia, for example, there is a strong need for nutritional assistance with more than 50% of children suffering from stunting, or low height for age. The map shows the 52 projects in the country and where they’re operating, and also provides details on the programs to help organizations working in common areas collaborate.

Other views show the prevalence of wasting, low infant birth weight, and the presence of anemia in children. While often the same countries show similarly low rates for all, that’s not always that case. Mauritania, for example, shows a high rate of low infant birthweight and relatively lower instances of stunting and wasting when compared to its neighbors. Information like this can help programs target efforts to what’s needed.
##Embeds and iframes
The 1,000 Days nutrition map is an example of a microsite being pulled into a larger site. 1,000 Days wanted to display the nutrition map from its main website, while keeping the framework of its website and allowing users to browse the map in more detail and without formatting constraints. This is achieved by embedding the map through an iframe into their main site and making it available to browse in a separate microsite accessed through a “full screen view” button.

This is a similar approach to embedding a map from a MapBox account onto a blog or any other website. Embeds and iframes allow for the easy integration of beautiful, data-rich maps and microsites like this into any website, while keeping with a site’s original format and requiring little to no technical work or maneuvering. For more details, see our documentation on the differences between embeds and APIs.
Technology powering the maps
We built these maps with our open source map design studio TileMill and host them on MapBox, which allows for easy embedding.
To test this out create a free account on MapBox. From there you can start making maps with TileMill, and when you’re ready, you can integrate side bars and layer-switchers using our open source javascript library Wax.
There’s documentation from MapBox about every step in this process, from our crash course in TileMill to building a microsite and a layer switcher. These open sources tools paired with this documentation make building microsites like 1,000 Days’ nutrition map possible for users of all levels of experience.
What we're doing.
Latest