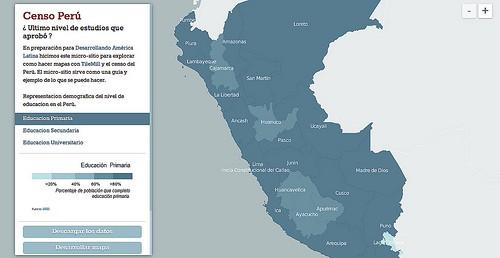
Over the last few days we have packaged education data from the 2007 Peru Census ahead this weekend’s Desarrollando America Latina hackathon in Lima to make it easier for participants to make maps with it. This data is now ready to be used, and you can download shapefiles from developmentseed.org/peru-census-education. The ID’s used for each state, province, and district can be copied and pasted into results for other Census questions, which will save data processing and cleaning time this weekend.
To give you a sense of what is possible we started playing with the data ourselves. Ruben pulled data answering the question “what was the highest level of school you achieved” and used it to construct choropleth maps of responses from Peru’s 26 states, 195 provinces, and 1841 districts. There were eight possible responses to the Census question, ranging from no education, to completion of primary and secondary school, to completion of the university. We aggregated this raw data to create three maps showing completion of primary education, secondary education, and university, which are all available on developmentseed.org/peru-census-education.

The site is actually made up of nine separate maps grouped together in sets of three to create three composited maps, with raw maps available on MapBox Hosting. Each map shows state data on the lowest zoom. As you zoom in, province data is shown and finally district data. Each composite map consists of one map each for state, province, and district level results. Each of the three pre-composite maps is designed to only show data at certain zoom levels. We used three maps for each composite so we could change the data shown on the map and in the tooltips at different zoom levels.
For example, this map shows the percentage of people who completed the university in Peru’s different provinces, with the darker color representing higher numbers. departamento_universidad By Ruben Lopeza.tiles.mapbox.com
If you’re at Desarrollando America Latina in Lima tomorrow, look for myself and Ruben to talk about map design. We’ll have a TileMill appliance for people to use and will be on hand to help install TileMill on personal computers and provide some quick training to help people get started using it.
Big thanks to Ian Villeda + AJ for their help with map design and the development of the microsite built on Wax.
What we're doing.
Latest