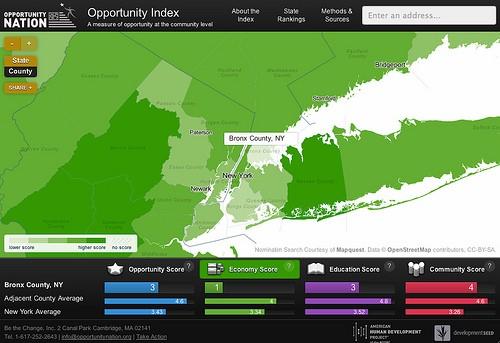
In partnership with Opportunity Nation, we developed a new data site that explores the impact of socio-economic factors on communities across the United States, opportunityindex.org. Mapping the potential opportunity for prosperity in various counties and states across the country creates a clearer picture of where improvement can be made and areas that should be targeted.
Background on the Opportunity Index
The premise of the Opportunity Index starts with three things that affect a person’s chances of prosperity in life:
-
Family environment (active, economically stable parents)
-
Personal characteristics (motivation, drive, ability to adapt and learn new skills)
-
Social environment (availability of jobs, safety, education, healthy environment)
The first of these is straight-up chance, and the second may vary largely based on the other two. So those interested in improving the lives of other people often focus on the third category. Nearly all of the factors in our social environment are human-made and alterable.

The Opportunity Index attempts to measure the social environment, or access to opportunity of people living in states and counties across the United States. It catalogs 13 different aspects of each state and county, such as unemployment and graduation rates, access to healthy food, and violent crime. These indicators fall into three broad categories: economy, education, and community. The index has a score for each of these categories, as well as an aggregate Opportunity Score.
Visualizing the data
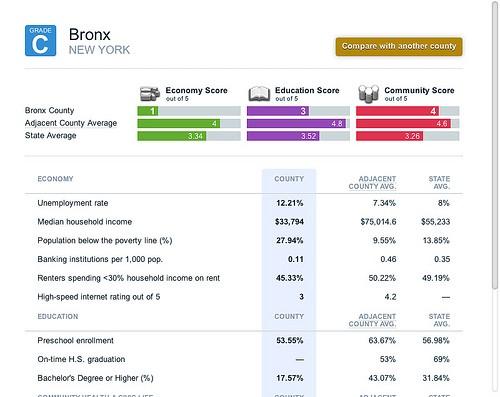
The Opportunity Index is now available as an interactive data site that exposes county and state profiles through national maps. Initially, we compare the three scores and overall opportunity through choropleth maps. The full profile of indicators that make up these scores are available by clicking on a county or state on the map. We computed a regional average to expose anomalies — consider conditions in the Bronx versus its adjacent counties.

Moreover, counties and states can be compared to each other directly. You can also find any address’s profile by entering a full street address, a county and state, or a ZIP Code in the search, which is generously made available by OpenStreetMap’s Nominatim search via MapQuest Open. Finally, each profile is designed with a print style-sheet, so profiles can be used for offline advocacy.
The technology
We wanted to make it incredibly quick to browse the map and toggle better profiles. We also wanted to make sure the Opportunity Index works well on tablets. Both speed and touch controls are native features of MapBox, so this was easy to do for the maps. We started with a spreadsheet of all the individual scores for each county and state, by each indicator. Then we loaded this into a PostGIS database to calculate the adjacent county scores and join the spreadsheet to shapefiles from the U.S. Census. Using TileMill, we designed the choropleth maps for each score and programmed the interactivity you see on the embeddable map. Once the maps are rendered to MBTiles and uploaded to MapBox Hosting, we’re able to use the MapBox Hosting API to integrate them into the Index.
The website itself is just one HTML page and a bunch of JSON documents. The whole application is hosted on GitHub Pages using Jekyll, as we do for this blog and many of our other projects. Reducing the website to its least common denominator — mark-up, styles, data, and scripts — keeps the whole experience incredibly fast. There is no database or CMS to slow things down. See for yourself by clicking through the Index (hint: you can press ‘esc’ to close profile pages). We converted the spreadsheet from CSV to JSON documents for each county and state and calculated adjacent indicator values using a Ruby script, so all data is pre-calculated.
For more information about Opportunity Index, check out the ‘About’ and ‘Methods and Sources’ sections. To get started designing your own fast maps for free, check out MapBox.
What we're doing.
Latest