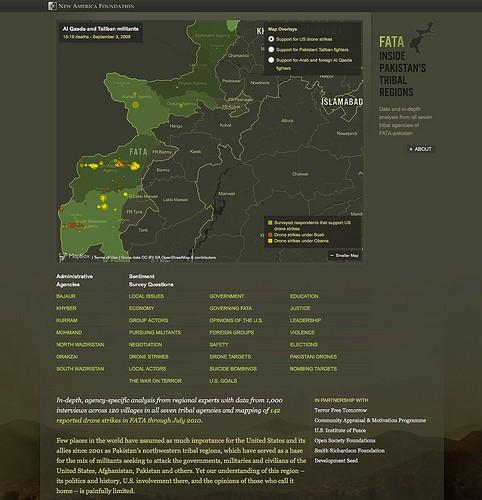
This morning the Counterterrorism Strategy Initiative at the New America Foundation released PakistanSurvey.org, opening data from 1,000 face-to-face interviews across 120 villages in Pakistan’s northwest Federally Administered Tribal Areas (FATA). The site is designed to let users quickly drill down and thin slice survey data and read agency-specific analysis from regional experts. This is the first comprehensive public opinion survey done in the region, and it is mashed with a mapping of 142 reported drone strikes in FATA through July 2010 to add additional context.

The architecture focuses on showing disaggregates for each of the seven agencies in FATA and breakouts for each survey question, allowing you to compare specific opinions across different agencies. Every response on both agency and question pages can be filtered by demographic data, gender, age, education, marital status, and income level.
Administrative Agencies
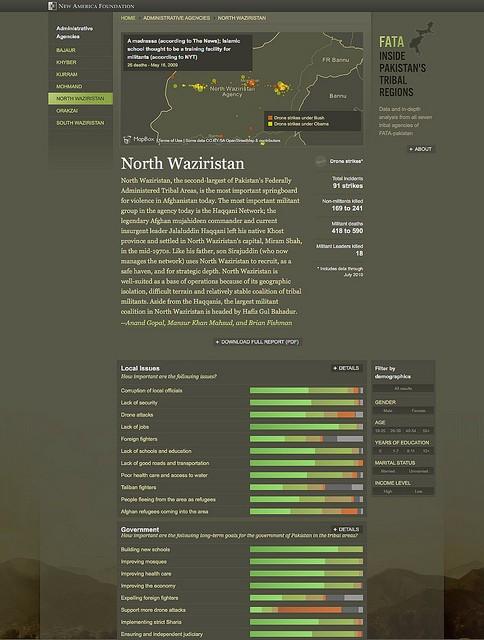
Each agency page exposes a full listing of local survey responses and a zoomed in map view of the area showing drone strikes. AJ designed the the drone strike overlay map by who authorized the strikes, Bush (in orange) or Obama (in yellow), and scaled the strike points based on the estimated number of militants and non-militants killed.
Below is a screenshot from the North Waziristan overview page, which is the second-largest agency in FATA and, as you can see from the drone strike data on the map, the center of U.S. drone operations in Pakistan. On the right hand side, there is a filter that adjusts the graphs by demographics.

Sentiment Survey Questions
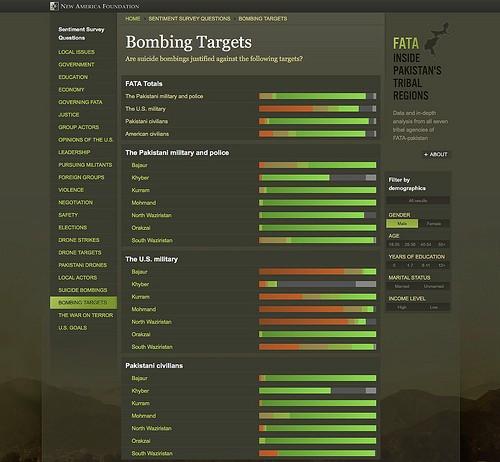
All of the 43 substantive questions from the survey are broken out to show both FATA wide-sentiment and sentiment at the agency level. The graphs are designed to make comparisons while skimming a large amount of data really fast. Here is a look at the multi-part question “Are suicide bombings justified against the following targets?” Like on the agency pages, you can filter responses by demographic.

Designing for Speed and Using Open Source
We built this site on top of Express, a very fast and small server-side JavaScript framework built on Node.js and Connect. For those new to Node.js, it is a low level toolkit designed for writing high performance server-side JavaScript applications. We used MongoDB for the database. The maps were made using OpenLayers, and they are all hosted on MapBox.com, leveraging some of the newer tools we’re building like TileLive, which Tom blogged about last week.
For this site, we needed to show a lot of data together without sacrificing a fast experience. Speed really matters when you are building interactive data sites like PakistanSurvey.org, and our goal here was to encourage a lot of browsing and filtering.
Background Information on the Survey
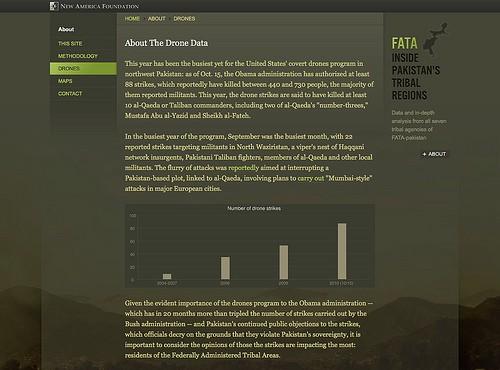
The original survey was conducted from June 30 to July 20, 2010 and has a margin of error of +/- 3 percent. The full methodology is available on pakistansurvey.org/about/methodology. There you can also find details about how the drone strike data was gathered.

The site was launched this morning at the the United States Institute of Peace by Peter Bergen, the co-director of the Counterterrorism Strategy Initiative at New America Foundation, the team that lead the survey work.
What we're doing.
Latest