We just added seven new map tilesets of Haiti to MapBox.com, created after the January 12 earthquake. Two of these sets are of terrain baselayers — one is a clean grey tile designed to be overlaid with data visualizations and the other is a terrain tile showing color-coded elevations in Haiti — and both cover the entire island. We also created three sets of overlays that work with the terrain data to show roads, collapsed buildings, and seismic data from the earthquake.

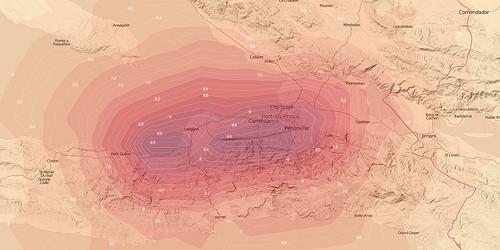
Seismic data from the January 12 earthquake in Haiti, overlaid on our Haiti Terrain Grey tile.
Baselayers specifics
The two terrain baselayers are generated from SRTM elevation models. Haiti Terrain is a combination of a hillshade/color-relief map and emphasizes the topography of the island. Haiti Terrain Grey is a hillshade layer intended to be used as a more subtle backdrop to additional overlaid data.
Overlays
The main overlay maps all roads, labels, parks, buildings, and some other features using data from OpenStreetMap. Volunteers have been doing an unbelievable job of improving OpenStreetMap in Haiti since the disaster. OSM’s data — which is completely open and free for anyone to use — is now the best source for Haiti maps and continues to improve every day. Best of all, it is being used on the ground to save lives.

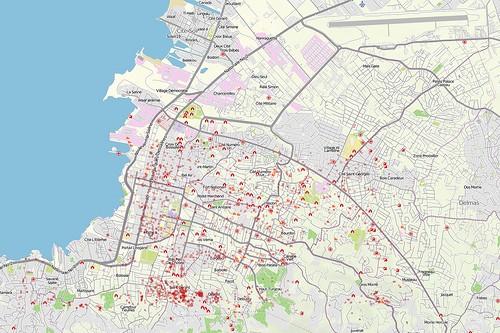
Using data from OpenStreetMap in combination with data from Logistics Cluster, we created an overlay indicating various obstacles related to the earthquake in the Port au Prince region. These include collapsed buildings, damaged infrastructure, landslides, and locations of spontaneous camps.
With seismic data released by the U.S. Geological Survey, we created two overlays visualizing how the strength of the earthquake radiated from the epicenter — one of the main earthquake on January 12 and another of the strongest aftershock, which occurred on January 20. These overlays show the Modified Mercalli Intensity, which is a measure of an earthquake’s effect on people, nature, and structures. On this scale, the epicenter of the primary earthquake experienced about 9.9 (“disastrous”), and the lowest felt in Haiti was about 4.6 (“moderate” approaching “rather strong”). Additionally, we have a simple overlay showing some of the fault lines in southern Haiti. Comparing these with the terrain layers is interesting as you can see how these faults have shaped the landscape.
The maps in action
Here’s a live demo of the new tiles. You can use the layer switcher to change baselayers and turn the overlays on and off.
Map data © OpenStreetMap & contributors, CC-BY-SA
The roads overlay and obstacles overlay were generated using the most recent data available yesterday. Because this information is still changing quickly, we will provide bi-weekly updates to these two tilesets.
To learn more about how to use these and other tilesets we’ve created, head over to MapBox.com/tiles.
What we're doing.
Latest