

The launch of the new MIX Market is a big win for open data in international development, and it vastly improves how rich financial data sets can be accessed. The MIX Market is like a Bloomberg for microfinance, publishing data on more than 1,500 microfinance institutions (MFIs) in more than 190 countries and affecting 80,021,351 people. Additionally, each MFI has as many as 150 financial indicators and in some cases going back as far as 1995. The goal of this tool is simple — to open this information up to help MFIs, researchers, raters, evaluators, and governmental and regulatory agencies better see the marketplace, and that makes for better international development.
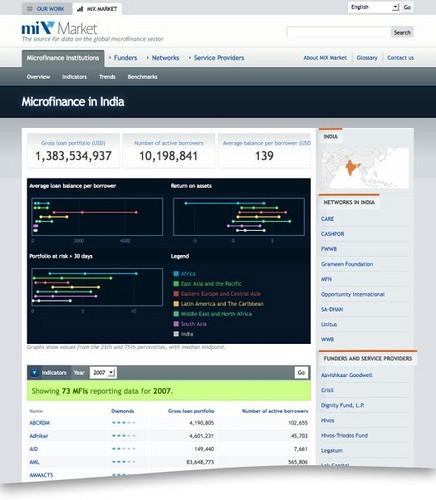
There are profiles for every country that the MIX Market is hosting. Take a look at the country landing page for India, showing how India stacks up to other peer groups and listing out all MFIs, networks, and funders and service providers.
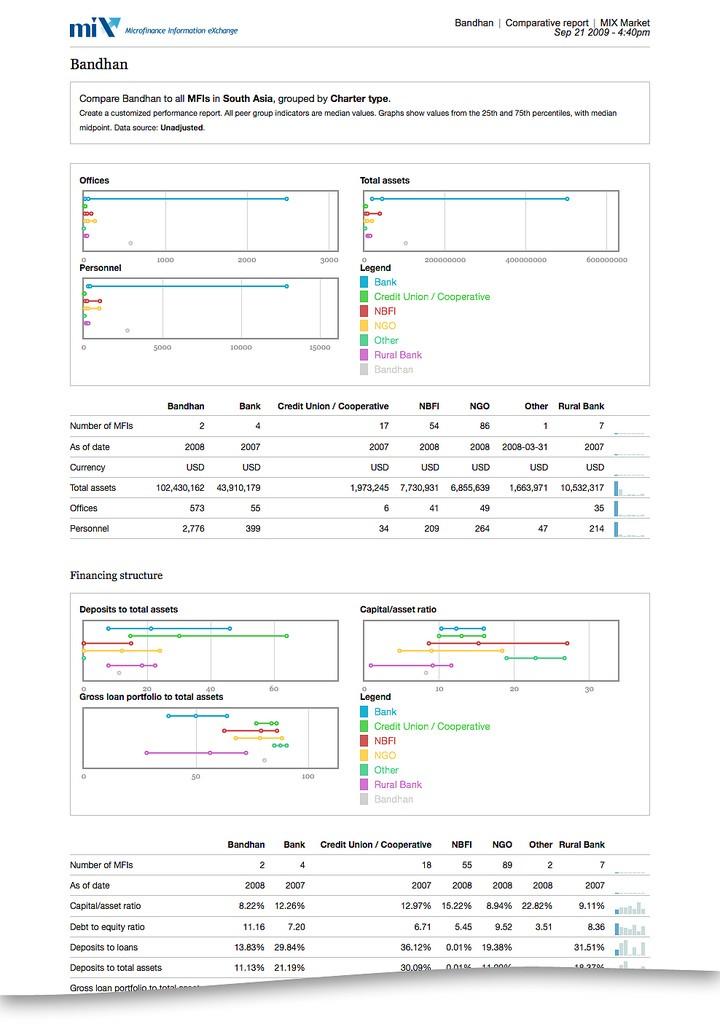
Here is a look at a single MFI profile. We tap MIX Market’s Salesforce database to create organization profiles like this one of the Indian microfinance institution Bandhan:
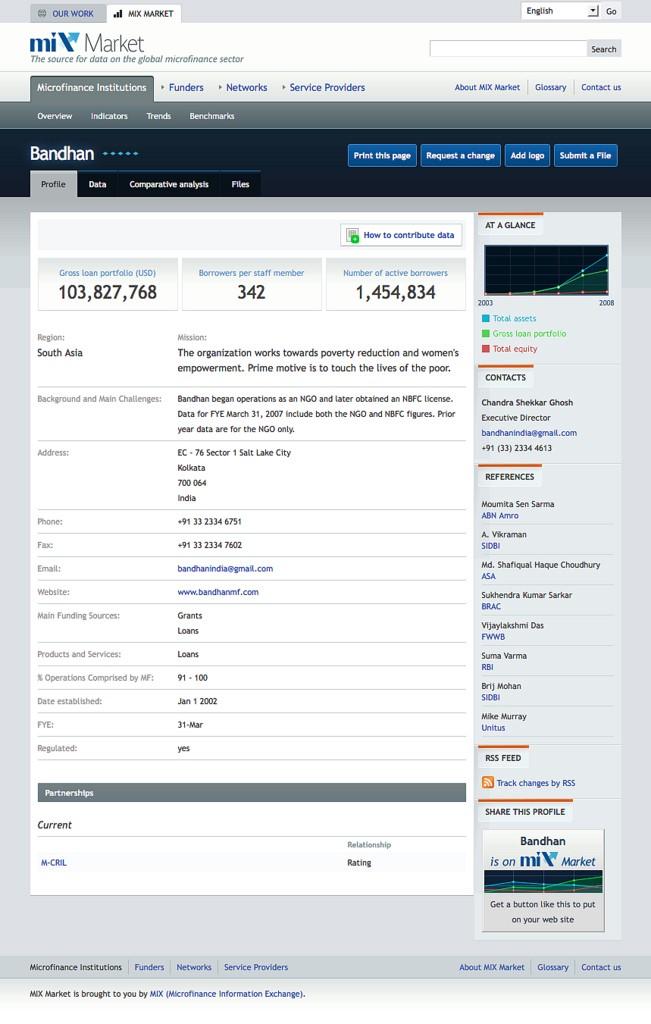
On each profile, users can access various tabs of financial data, each one showing key indicators as graphs. Here we use sparklines for compressed visualizations of a trend on an indicator. These letter-sized graphs are unimposing but indispensible for quickly skimming large data sets.
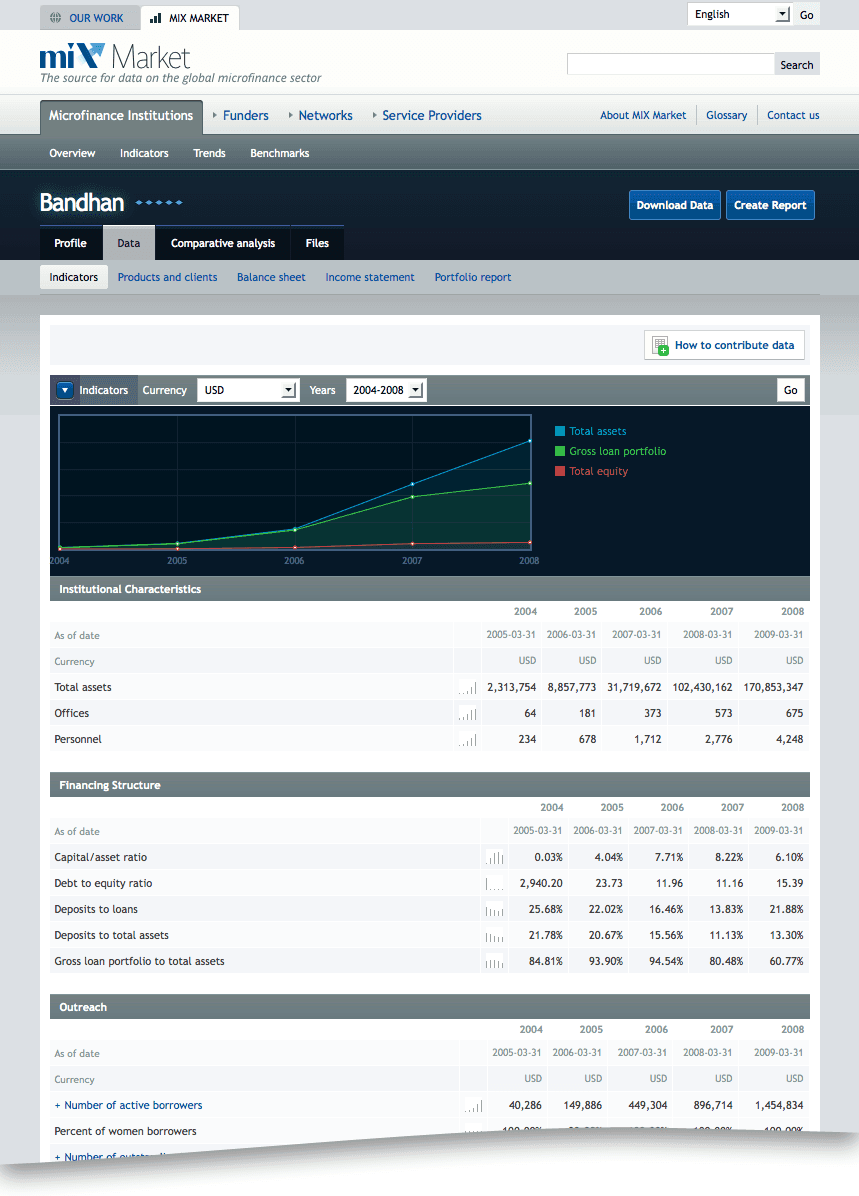
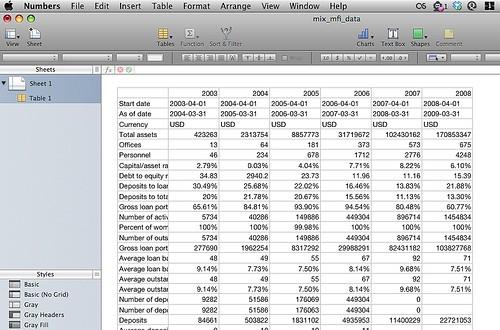
MIX Market did very helpful phase zero surveys with their members. Many requested downloads for financial data sets so that more sophisticated computations could be executed offline. To that end, all financial data for an MFI can be downloaded as one CSV. Moreover, we paid attention to keeping URLs and formats consistent so that financial data can also be accessed by machines.
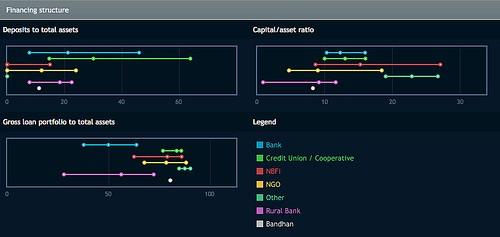
One of MIX Market’s crucial services is to publish numbers from specific groups within MFIs — for example, by age, profit status, or geographical location. These so called “peer groups” are then used for comparisons. For instance, here we compare the aforementioned MFI Bandhan to all their peers in South Asia, grouped by profit status.
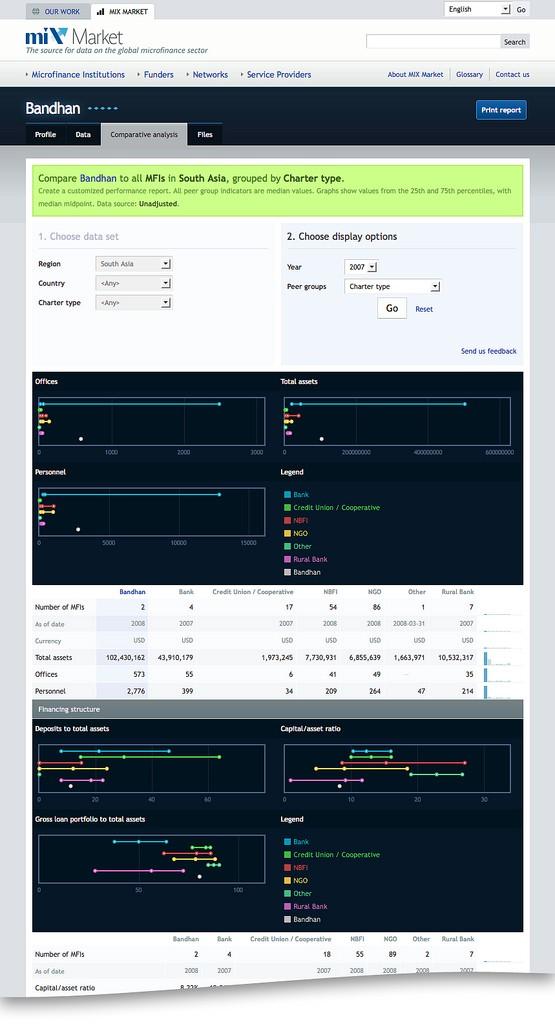
An interesting detail in these reports are the graphs. They show the median as well as the spread between the 25th to the 75th percentile, which represents the distribution of a peer group in a very intuitive way.
In the past, MIX Market had assembled these kinds of comparisons manually by processing spreadsheets and compiling results with a word processor, and then distributed them as email attachments or printed documents. Exposing this information directly to their users online significantly reduces workload for their staff. However, there is a still a strong need to print these comparisons for meetings and reporting purposes. We created solid print stylesheets, taking advantage of the higher resolution of paper, to make it easy to download and print beautiful reports.
The toolset on MIXMarket.org is similar to other projects we’ve built, such as the Federal Education Budget Project that opened up and mapped data on U.S. public school districts and the Food Security Maps that sucks in and displays real-time data from food security organizations working in Africa. Publishing rich data sets like this online presents special challenges, particularly in storage and in the presentation layer, and we are always working to improve our strategies and toolsets to bring complex data online in more efficient ways. This was a fun project that allowed us to try new approaches and improve our methods.
Lastly, I’d like to share a technical spec overview of MIXMarket.org:
-
Drupal 6.x
-
Integration with external SQL database via Flatstore and Views
-
Integration with Salesforce with Salesforce module and FeedAPI
-
Extensively customized views handlers
-
18,000 nodes of microfinance institutions, funders, contacts, service providers, and so on
-
About 20 users with administrative permissions
-
More than 1,000 visits and 7,000 page views on an average weekday
What we're doing.
Latest