#!pip install intake h5netcdf matplotlibCreate Zarr Pyramid
In this notebook, we create a Zarr pyramid store for the CMIP6 tas (near-surface air temperature) daily data available in NetCDF on S3. We use the ndpyramid library from carbonplan. This library offers either the pyramid_coarsen method of aggregating data or the pyramid_reproject method. The pyramid_reproject method reprojects data to different dimensions, which usually correspond to different zoom levels when visualizing the data on a map. This is useful for making the data “square” which is how tiles are used on maps. pyramid_coarsen creates a multiscale pyramid via coarsening of a dataset by given factors (ndpyramid source).
1.1 Install and import libraries
from carbonplan_data.utils import set_zarr_encoding
from carbonplan_data.metadata import get_cf_global_attrs
import fsspec
import json
import matplotlib
from ndpyramid import pyramid_reproject, pyramid_coarsen
import numpy as np
import s3fs
import xarray as xr

import sys; sys.path.append('..')
import helpers.eodc_hub_role as eodc_hub_role
/srv/conda/envs/tile-benchmarking/lib/python3.9/site-packages/carbonplan_data/__init__.py:29: UserWarning: CARBONPLAN_DATA environment variable not set, `carbonplan.data.cat` may not work as expected.Known data locations include: ['https://storage.googleapis.com/carbonplan-data', 'https://carbonplan.blob.core.windows.net/carbonplan-data'].
warnings.warn(msg)credentials = eodc_hub_role.fetch_and_set_credentials()
bucket = 'nasa-eodc-data-store'Note: This is adapted from https://github.com/carbonplan/benchmark-maps/blob/datasets/stores/01b_cmip6_netcdf_to_zarr.ipynb.
1.2 Set parameters
#parameters
model = "GISS-E2-1-G"
variable = "tas"
anon=True
# Initiate fsspec filesystems for reading and writing
s3_path = f"s3://nex-gddp-cmip6/NEX-GDDP-CMIP6/{model}/historical/r1i1p1*/{variable}/*"
fs_read = fsspec.filesystem("s3", anon=anon, skip_instance_cache=False)
fs_write = fsspec.filesystem("")# Retrieve list of available months
file_paths = fs_read.glob(s3_path)
print(f"{len(file_paths)} discovered from {s3_path}")65 discovered from s3://nex-gddp-cmip6/NEX-GDDP-CMIP6/GISS-E2-1-G/historical/r1i1p1*/tas/*file_paths[0]'nex-gddp-cmip6/NEX-GDDP-CMIP6/GISS-E2-1-G/historical/r1i1p1f2/tas/tas_day_GISS-E2-1-G_historical_r1i1p1f2_gn_1950.nc'1.3 Test we can open the files
fs_s3 = s3fs.S3FileSystem(anon=True)
s3_file_paths = [f's3://{file_path}' for file_path in file_paths]
fileset = [fs_s3.open(file) for file in s3_file_paths[0:2]]
ds = xr.open_mfdataset(fileset, combine='by_coords')
ds
/srv/conda/envs/tile-benchmarking/lib/python3.9/site-packages/xarray/core/concat.py:546: FutureWarning: unique with argument that is not not a Series, Index, ExtensionArray, or np.ndarray is deprecated and will raise in a future version.
common_dims = tuple(pd.unique([d for v in vars for d in v.dims]))<xarray.Dataset>
Dimensions: (time: 730, lat: 600, lon: 1440)
Coordinates:
* time (time) object 1950-01-01 12:00:00 ... 1951-12-31 12:00:00
* lat (lat) float64 -59.88 -59.62 -59.38 -59.12 ... 89.38 89.62 89.88
* lon (lon) float64 0.125 0.375 0.625 0.875 ... 359.1 359.4 359.6 359.9
Data variables:
tas (time, lat, lon) float32 dask.array<chunksize=(365, 600, 1440), meta=np.ndarray>
Attributes: (12/23)
downscalingModel: BCSD
activity: NEX-GDDP-CMIP6
contact: Dr. Rama Nemani: rama.nemani@nasa.gov, Dr. Bridget...
Conventions: CF-1.7
creation_date: 2021-10-04T18:41:40.796912+00:00
frequency: day
... ...
history: 2021-10-04T18:41:40.796912+00:00: install global a...
disclaimer: This data is considered provisional and subject to...
external_variables: areacella
cmip6_source_id: GISS-E2-1-G
cmip6_institution_id: NASA-GISS
cmip6_license: CC-BY-SA 4.02: Create Pyramid
VERSION = 2
PIXELS_PER_TILE = 128
longitute_length = ds[variable].lon.shape[0]
max_levels = round(np.sqrt(longitute_length/PIXELS_PER_TILE)) + 1
max_levels4# create the pyramid
LEVELS=max_levels
ds = ds.rio.write_crs('EPSG:4326')We can use either pyramid_reproject or pyramid_coarsen. pyramid_reproject will reproject data to create square data at the dimensions required for generating traditional tiles. In this example, we assume 128 pixels per tile. pyramid_coarsen will maintain the aspect ratio of the underlying dimensions (lat and lon in this case) and create aggregations at each level of factors to create reduced resolution data.
Both produce a datatree with 4 groups at 4 levels of resolution.
pyramid_reproject
- Level 0: 128 x 128
- Level 1: 256 x 256
- Level 2: 512 x 512
- Level 3: 1024 x 1024
Because the dimension of our data is only 600 x 1440, it doesn’t make sense to produce any additional levels beyond level 3.
When generating pyramids via pyramid_reproject certain pixels (i.e. data values) will be NaN to make the data square. Presumably, these NaN would be present in the image tiles produced with the coarsened dataset too since all tiles are square.
pyramid_coarsen
- Level 0: 360 x 150
- Level 1: 480 x 200
- Level 2: 720 x 300
- Level 3: 1440 x 600
%%time
pyramid_reprojected = pyramid_reproject(ds, projection='equidistant-cylindrical', other_chunks={'time': 1}, levels=LEVELS)
CPU times: user 1min 53s, sys: 29.5 s, total: 2min 22s
Wall time: 4min 47s%%time
pyramid_coarsened = pyramid_coarsen(ds, factors=[4, 3, 2, 1], dims=['lat', 'lon'], boundary='trim')CPU times: user 15.9 ms, sys: 0 ns, total: 15.9 ms
Wall time: 15.4 ms/srv/conda/envs/tile-benchmarking/lib/python3.9/site-packages/ndpyramid/core.py:51: PerformanceWarning: Reshaping is producing a large chunk. To accept the large
chunk and silence this warning, set the option
>>> with dask.config.set(**{'array.slicing.split_large_chunks': False}):
... array.reshape(shape)
To avoid creating the large chunks, set the option
>>> with dask.config.set(**{'array.slicing.split_large_chunks': True}):
... array.reshape(shape)Explictly passing ``limit`` to ``reshape`` will also silence this warning
>>> array.reshape(shape, limit='128 MiB')
plevels[str(key)] = ds.coarsen(**kwargs).mean()
/srv/conda/envs/tile-benchmarking/lib/python3.9/site-packages/ndpyramid/core.py:51: PerformanceWarning: Reshaping is producing a large chunk. To accept the large
chunk and silence this warning, set the option
>>> with dask.config.set(**{'array.slicing.split_large_chunks': False}):
... array.reshape(shape)
To avoid creating the large chunks, set the option
>>> with dask.config.set(**{'array.slicing.split_large_chunks': True}):
... array.reshape(shape)Explictly passing ``limit`` to ``reshape`` will also silence this warning
>>> array.reshape(shape, limit='128 MiB')
plevels[str(key)] = ds.coarsen(**kwargs).mean()#display(pyramid_reprojected), display(pyramid_coarsened)
import hvplot.xarray as hvplot
pyramid_reprojected['/0']['tas'].isel(time=0).hvplot(aspect='equal')Note this is slow because the coarsened pyramid has not been rechunked to 1 time step per chunk.
%%time
pyramid_coarsened['/0']['tas'].isel(time=0).hvplot(aspect='equal')
CPU times: user 9.11 ms, sys: 4.05 ms, total: 13.2 ms
Wall time: 12.8 msWe can use either dataset, but will use the reprojected dataset for now since that is the method benchmark-maps uses (see https://github.com/carbonplan/benchmark-maps/blob/main/notebooks/utils.py#L149-L155).
datasets = {'reprojected': pyramid_reprojected, 'coarsened': pyramid_coarsened }

for dt in datasets.values():
    # modify the data in the pyramid
    for child in dt.children.values():
        child.ds = set_zarr_encoding(
            child.ds, codec_config={"id": "zlib", "level": 1}, float_dtype="float32"
        )
        if 'x' in child.ds and 'y' in child.ds:
            child.ds = child.ds.rename({'x': 'lon', 'y': 'lat'})
            # Don't store multiple chunks per spatial region, they're small enough!
        child.ds = child.ds.chunk({"lat": -1, "lon": -1, "time": 1})
        child.ds[variable].attrs.clear()
    dt.attrs = get_cf_global_attrs(version=VERSION)
    dt.ds.attrs['multiscales'] = [{'datasets': {}, 'metadata': {'version': VERSION }}]
    for level in range(LEVELS):
        slevel = str(level)
        dt.ds.attrs['multiscales'][0]['datasets'][level] = {}
dt.ds.attrs['multiscales'][0]['datasets'][level]['pixels_per_tile'] = PIXELS_PER_TILE %%time
for k, dt in datasets.items():
# write the pyramid to zarr
fs = s3fs.S3FileSystem(anon=False)
store_name = f"test-data/pyramid-{k}/CMIP6_daily_{model}_{variable}.zarr"
save_path = s3fs.S3Map(root=f"{bucket}/{store_name}", s3=fs, create=True)
dt.to_zarr(save_path) CPU times: user 4min 8s, sys: 23.3 s, total: 4min 32s
Wall time: 5min 19sshared_vars = {
'variable': variable,
'extra_args': { 'multiscale': True }
}
cmip6_datasets = {
'cmip6-pyramid-reprojected': {
'dataset_url': f"s3://{bucket}/test-data/pyramid-reprojected/CMIP6_daily_{model}_{variable}.zarr",
'lat_extent': [-89, 89],
'lon_extent': [-179, 179],
**shared_vars
},
'cmip6-pyramid-coarsened': {
'dataset_url': f"s3://{bucket}/test-data/pyramid-coarsened/CMIP6_daily_{model}_{variable}.zarr",
'lat_extent': [-59, 89],
'lon_extent': [-179, 179],
**shared_vars
}
}
with open('cmip6-pyramid-datasets.json', 'w') as f:
f.write(json.dumps(cmip6_datasets))
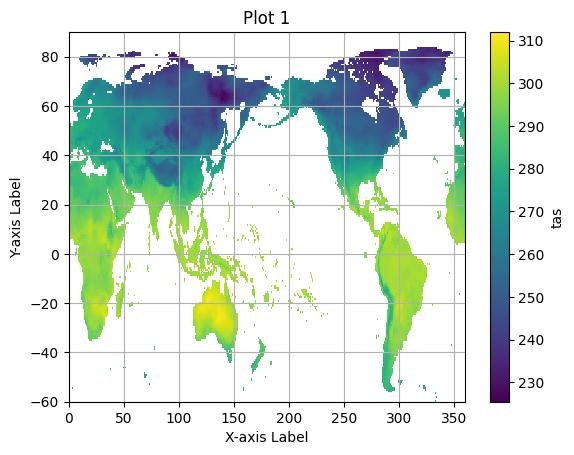
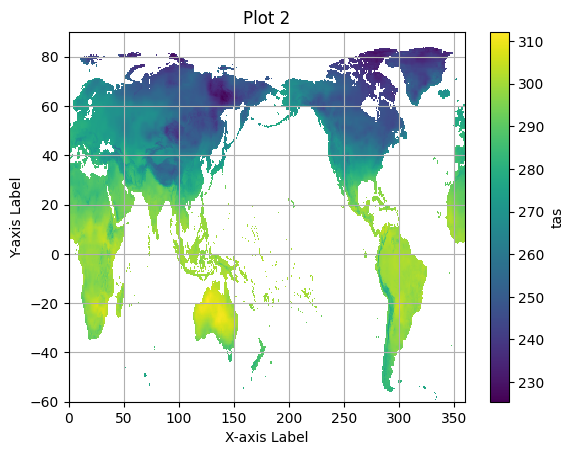
f.close()Checking our work
Below is some code to open and plot the pyramids to make sure everything worked as expected.
pyramid_ds = xr.open_zarr(save_path, consolidated=True, group=2)pyramid_ds['tas']<xarray.DataArray 'tas' (time: 730, lat: 300, lon: 720)>
dask.array<open_dataset-tas, shape=(730, 300, 720), dtype=float32, chunksize=(1, 300, 720), chunktype=numpy.ndarray>
Coordinates:
* lat (lat) float32 -59.75 -59.25 -58.75 -58.25 ... 88.75 89.25 89.75
* lon (lon) float32 0.25 0.75 1.25 1.75 ... 358.2 358.8 359.2 359.8
spatial_ref float64 ...
* time (time) object 1950-01-01 12:00:00 ... 1951-12-31 12:00:00print(save_path)
pyramid_ds = xr.open_zarr(save_path, consolidated=True)
pyramid_ds.multiscales[0]['datasets']<fsspec.mapping.FSMap object at 0x7f5d34121640>{'0': {'pixels_per_tile': 128},
'1': {'pixels_per_tile': 128},
'2': {'pixels_per_tile': 128},
'3': {'pixels_per_tile': 128}}import matplotlib.pyplot as plt
for group in pyramid_ds.multiscales[0]['datasets'].keys():
pyramid_group = xr.open_zarr(save_path, consolidated=True, group=group)
zoom_zero = pyramid_group.isel(time=0)
plt.figure() # Create a new figure for each plot.
zoom_zero.tas.plot()
plt.title(f"Plot {group}") # Set a title for each plot.
plt.xlabel("X-axis Label")
plt.ylabel("Y-axis Label")
plt.grid(True)
plt.show()