Assessing Science Code#
“Assessing code” means analyzing your code without altering what your code does. The goal is to figure what it is doing, how long it takes, and what it outputs.
Importantly, this is not about changing code. See Improving Science Code for that. The idea is that before you try to change things you need to understand what is going on. And if you are trying to make things faster, you need to know how long they take to run right now.
Measuring Code#
A lot of these suggestions will assume that you are running Python code within a Jupyter notebook.
Performance#
The most obvious way to measure code is by seeing how long it takes to run. In Jupyter notebooks there are certain magics that can give you a quick sense of how long things take. At the top of the cell put %%time then whenever you run the cell you will get an output of how long it takes. There is also an Execute Time notebook extension that provides per-cell execution time.
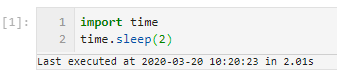
Source: deshaw/jupyterlab-execute-time
If your code has a lot of functions here is a little decorator that you can use to time them. Just copy timed and add @timed on the line above a function definition to get a print out of how long it takes for the function to run.
from functools import wraps
from time import time

def timed(f):
    @wraps(f)
    def wrap(*args, **kwargs):
        t_start = time()              # capture the start time
        result = f(*args, **kwargs)   # run the function
        t_end = time()                # capture the end time
        t_diff = (t_end - t_start)    # get the time difference

        # humanize the time difference
        if t_diff > 60:
            took = f"{t_diff / 60:.2f} min"
        elif t_diff > 1:
            took = f"{t_diff:.2f} sec"
        else:
            took = f"{t_diff * 1000:.2f} ms"

        print(f"func:{f.__name__} took: {took}")

        return result                 # return the result of the function
    return wrap
Profiling#
Getting timings per-function is a step down the path towards code profiling. Profiling is for when you want to get a better sense of what part of a piece of code is taking the most time. If you are just getting started you can try out snakeviz to get a visual representation of how long each subfunction takes.
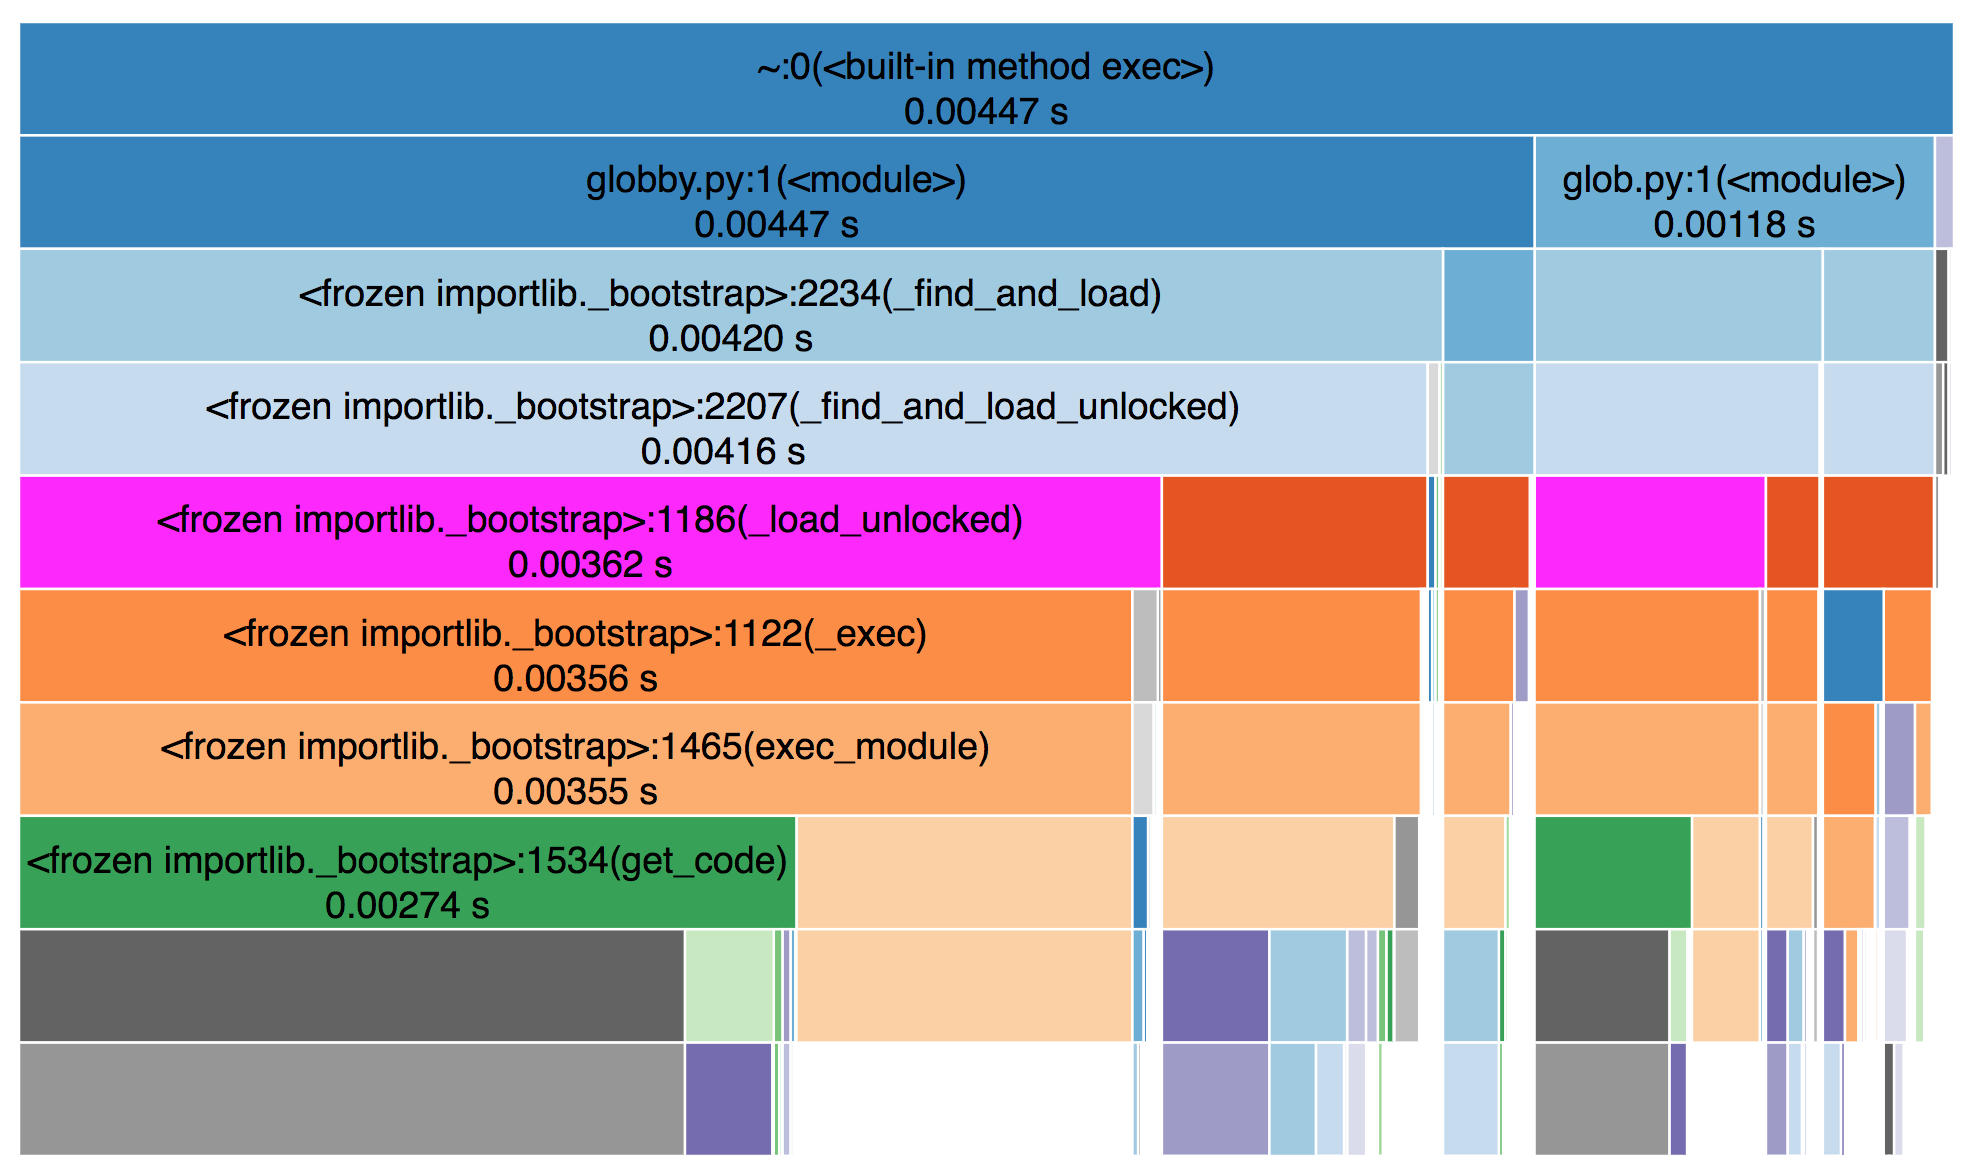 Source: https://jiffyclub.github.io/snakeviz/
To get a more complete sense of the memory and compute utilization there are lightweight tools like psrecord and heavier tools like scalene that give all kinds of detailed information and can even provide suggestions for optimization.
Benchmarking#
If you are concerned about long-term degradation of your work, then you can use benchmarking to measure performance over time. That way you can track if things start taking longer than they used to and avoid getting to a place where you “just feel” like things used to be faster.
This is especially useful for projects that are developed over time by a group of people. There is sometimes a tendency to graft new functionality onto existing functions and that can ultimately slow things down and make functions hard to understand and debug.
Understanding code#
Debugging#
Before we get into it, just know there is nothing wrong with sticking a print statement in your code to start getting a sense of what’s going on.
If your code is raising an error you can use pdb to check out out what’s going on. In Jupyter notebook you can enter a pdb session just by running %pdb in an empty cell. Then if you rerun the cell that was raising an error you will be dropped into an interactive pdb session.
Using pdb takes some getting used to, but some quick tips:
use
lto list the lines of code around the part you are looking at.use
uto step back up into the function that called the one you are in.use
nto run the next line of code.use
ppto pretty print a variable.
Even if you don’t have an error, but just want to inspect in more detail what is happening within a function you can use pdb. Add breakpoint() at any point in your code the next time you run it you will enter a pdb session at that line.
Tests#
Tests are one of the software development tools that is perfectly suited to science code. The notion of a test is that you make a statement about what the output of a particular function should be. Here is an example of a test:
def test_read_input_file():
   df = read_input_file("tests/data/filename.csv")

   assert df.columns == ["time", "lat", "lon", "air_temperature"]
Focus on testing things that your function is doing not things that another library is responsible for. For instance you don’t need to test pd.read_csv but you do need to test conversions that you do after reading in the data.
Visualizing output#
Visualizations are not always included as part of assessing code, but they are crucial for improving intuition about what’s going on. The visualizations that you create while working on code can be very different than ones that you would make for a published paper. There are several libraries in the scientific python stack that try to make it is simple as possible to go from data to a visual representation. If you are already comfortable with one of those libraries you should use that. If you don’t have a favorite library yet, then take a look at hvplot.